
A note on terminology
In this article I use the term ‘researchers’ to represent university based academics who are conducting research as part of their studies or work, and ‘co-researchers’ to represent, in its widest sense, people from beyond the academy who might work in collaboration with them, such as staff and volunteers from partner organisations, or members of the group or community being researched, who have agreed to take part in some aspects of development or delivery of a research project. The term “young people with SEND” is used as it was the preference of the co-researchers in this project, and they chose their own pseudonyms.
Aims and Claims of Co-production
Across the social sciences, recent growth in the use of participatory research methods reflects increasing commitment to research ‘with’ participants, not ‘on’ them (Barker & Weller, 2003). As the range of terminology related to participatory research has expanded, co-production has become a “buzz-word” (Ledger & Slade, 2015, p. 157), associated with emancipatory values and the potential to destabilise hierarchies of power and privilege (Bell & Pahl, 2018). However, its use as an umbrella term for a proliferation of ways of working with different groups of people beyond academia has led to “definitional ambiguity” (Nabatchi et al., 2017, p. 766) blurring what different parties mean by co-production (Williams et al., 2020). Who we consider co-researchers, the extent of their involvement, the amount and role of people involved, and the different stages of the research process when the involvement occurs are all variable factors (Harder et al., 2013; Vaughn & Jacquez, 2020). Horner (2016) proposes that to truly claim that knowledge is “co-constructed” with community partners there is a requirement for shared theoretical and philosophical thinking, rather than simply including co-researchers in narrowly defined roles working towards goals predetermined by academics (Horner, 2016, p. 9). There has been rigorous criticism of research which claims to be co-produced but perpetuates existing power imbalances (Eisenstadt & McLellan, 2020, p. 243). Acknowledging that labels like participatory and co-produced research are applied unevenly, it is nevertheless encouraging to consider the increasing and broad range of such endeavours as “part of an iterative process of overcoming power imbalances in research” (Beebeejaun et al., 2014, p. 40).
Whilst studies including co-researchers in planning, data collection and dissemination are increasingly common, projects including co-researchers in analysis are harder to find (Cashman et al., 2008). Whilst exact terminology might vary, the analysis process is commonly described as a “cutting up” of data (e.g. Beuving & Vries, 2015; Erlandson et al., 1993; Lincoln & Guba, 1985), breaking it into “codes” (Braun & Clarke, 2023) or “units” (Lincoln & Guba, 1985) and then sorting into “themes” (Braun & Clarke, 2023) or “categories” (Erlandson et al., 1993). A wide range of approaches can be applied, which may each produce different findings (Dey, 1993; Ryan & Bernard, 2003). Whilst the terminology of chopping up is common, Lincoln and Guba’s seminal work clarifies that the analysis process is “essentially a synthetic one” in which ultimately the gathered data is “reconstructed into meaningful wholes” (Lincoln & Guba, 1985, p. 333). As such, the analysis process seems ripe with potential for creative and participatory approaches.
However, university researchers often maintain control of data analysis, even when other activities have been participatory (Best et al., 2021; Jackson, 2008). Key reasons given for this exclusion have been summarised as analysis requiring too much time from co-researchers, needing specialist training or skills, needing a university researcher with expertise to lead collaborative analysis sessions, there being too much data to ask co-researchers to work through, and analysis not being a rewardingly enjoyable or accessible task for co-researchers (Albrechtsen, 2025). Where co-researchers are included in analysis sessions, they may be offered training to participate, for example taught coding skills (e.g. Clark et al., 2022) or may collaborate on hypothesising about findings, whilst the academics do the time-consuming coding (e.g. Arcaya et al., 2018). Involvement in analysis can require a significant time commitment (Jackson, 2008), which needs to fit around co-researchers’ lives (Cashman et al., 2008), and when co-researchers must learn academic skills, this potentially undermines a key benefit of involving them, and respecting their forms of knowledge, in the first place (Best et al., 2021). A review of sixty studies suggested community partners themselves often felt involvement in the data analysis stages would be too onerous, and so university researchers excluded them in order to protect them from “overwhelm” (Cashman et al., 2008). There are additional ethical challenges to ensure that co-researchers are protected from feeling overburdened or being exposed to sensitive material, and that participants’ anonymity is protected if their comments will be analysed by peers (Clark et al., 2022). Albrechtsen (2025) also proposes that participatory analysis should be an enjoyable experience with a positive and supportive atmosphere where all participants feel able to contribute equally to analysis processes, and develops a board game format to engage co-researchers in analysis of data. It is important to find ways to allow co-researchers themselves to “set the linguistic level of communication” (Clark-Ibanez, 2008, p. 103). This may require an analysis process “beyond text” as written language can reinstate hierarchies (Beebeejaun et al., 2014), and this is particularly pertinent when working with co-researchers with SEND.
Using Arts-based research methods to include co-researchers in analysis
Traditional research methods, such as interviews and questionnaires, often require fluency in written or verbal English, and “marginalised citizens who cannot speak the language of research are thereby silenced” (Williams et al., 2020, p. 6). Arts-based research (ABR) offers researchers opportunities to challenge the power imbalances inherent in word-based research activities (Beebeejaun et al., 2014) suggesting its suitability for working with young people with SEND, who are at high risk of exclusion from research (Runswick-Cole et al., 2018). Whilst ABR can be applied throughout the research process, it is most commonly reported as a method for data creation: Art-making activities can give participants extra time to create images as prompts for discussion, aiding memory and reflection (Bagnoli, 2009), pictures can represent complex and consecutive events simultaneously, removing the need for linear chronological narrative skills (Willer et al., 2018), and visual metaphors can be created which communicate complex ideas succinctly (McKay & Barton, 2018). When young people produce art as data, researchers describe being able to see something previously unknown: zine-making with trans youth enabled them to create counter stories which acknowledged both the good and bad aspects of their experiences (Asakura et al., 2020) and participants’ use of cameras helped them to produce visual data which challenged assumptions, giving children a “visual voice” (Burke, 2008, p. 33). When researching with young people with SEND, openness to a range of communication styles is necessary, and research questions might be explored using a range of modalities, including speech, Makaton, eye-contact, drawing, puppetry, sand-boxing and photography, as well as working closely with adults who know children’s communication styles well (Pickering, 2018). A common reason given for the choice of visual methods with children is that it is perceived as enjoyable (e.g. Drew et al., 2010), although Barker and Weller warn that researchers should challenge this assumption (2003, p. 3) and it must be acknowledged that even if the data creation activities are enjoyable, visual research can still be extractive (Visse et al., 2019). Using ABR approaches to disseminate findings has also demonstrated the potential for sharing research creatively with audiences beyond the academy, such as the Remembering Baby project which culminated in a moving gallery exhibition (Reed et al., 2018) and a collaborative installation in which neon and glittery sculptures of food became visual metaphors to articulate complex feelings about food poverty (Wheeler, 2018).
The benefits of ABR in creating and sharing data, then, is well documented, but despite analysis being “the central step in qualitative research” (Flick, 2014, p. 3) this stage is sometimes overlooked as an opportunity for the use of creative methods to support inclusion of co-researchers (Leitch, 2008; Nind, 2011). Art-making has traditionally been rarely used in the analysis process (Yuen, 2016) and “the perspectives of participants are often missing in the transfer from research activity to analysis” (Mannay et al., 2024, p. 12). This is perhaps because analysing visual data poses researchers a new set of challenges. Art historian Elkins describes pictures as “confusing, daunting, unexpectedly obdurate objects that possess formidable defences against quick readings” (Elkins, 1998, p. xii). Indeed, an advantage of using art is the ability to communicate something hard to put into words, and therefore, by its very nature, it is hard to make definitive claims about meaning. Barone and Eisner propose that it is precisely because of the nuance and ambiguity of art that it has the potential to “enlarge the conceptual umbrella that defines the meaning of research itself” (Barone & Eisner, 2012, p. 2).
A significant benefit of using arts-based analysis methods with young people with SEND is the opportunity this presents for reflective, collaborative interpretations in which their “expert testimony” is respected (Thomson, 2008, p. 1). Young people who have created the data should be included in its analysis, as meanings “may not be amenable to straightforward adult readings” (Thomson & Hall, 2008, p. 10). Whilst some researchers check understandings of young participants’ artworks with family members (Willer et al., 2018), other researchers have addressed this problem by discussing an individual art work with the participant that produced it (Burke, 2008). Some projects also include group discussion of the visual data gathered, for example the technique of photovoice encourages participants, after taking the photos, to talk in a group about them, which can help identify common themes and deepen contextual understanding of the photos (e.g. Foster-Fishman et al., 2010). Yuen (2016) describes a participatory arts-based analysis which involved participants writing their responses to each other’s artworks. These examples show a move towards more creative collaborative analysis processes, but if participants must then explain data in words, traditional hierarchies can re-emerge (Nind, 2011). The inclusion of co-researchers in data analysis through creative activities has the potential to deepen our understanding of the data by triangulating analysis with co-researchers in modalities of their own preference.
Growing interest in such approaches is reflected in the 2024 publication of the Handbook of Creative Data Analysis, edited by Kara, Mannay and Roy, which features examples of creative data analysis in collaboration with co-researchers with SEND. These include a university researcher working with a group of adults with learning disabilities using creative activities to agree shared themes and findings from their work on sex and relationships; they argue that “Researching collaboratively enabled us to collectively construct an understanding of our experiences, while breaking down power barriers and creating a space to have a voice” (Mannion & the R and S Research Team, 2024, p. 374). In another example, autistic girls create stories which encapsulate the ideas in the gathered data (East et al., 2024). I also hoped to find an approach which allowed me to look at data with co-researchers with SEND as equal partners, and ask them “What would you like to do with this information about you and your experience?” (Thorburn, Hibbard, et al., 2008, p. 148).
This tutorial proposes analysis methods with the following aims:
-
Reduce co-researcher “overwhelm” (Cashman et al., 2008) from amount of data and time required
-
Reduce language barriers to analysing data
-
Are enjoyable or rewarding in some way
-
Do not require expert skills and training
-
Respect and value alternative modes of knowing
The following activities are presented as example approaches to collaborative analysis at the following stages:
-
Introducing key vocabulary
-
Familiarisation with data
-
Identifying, naming and refining codes, themes, connections and patterns
-
Prioritising and presenting key findings
At each stage I initially present activity instructions, which I hope researchers will adapt for their own contexts, and then share reflections on my use of these methods with a group of young co-researchers, to support the instructions by illustrating them in practice.
Background
The approach discussed in this tutorial was developed during my ESRC funded doctoral research at The University of Sheffield. It was planned and delivered in close partnership with a community organisation supporting young people with SEND in a town in South Yorkshire, England, who shared their in-depth understanding of the needs of the young participants and co-researchers. The research explored young people’s hopes and fears about the future. 21 young people aged 5-26 with a wide range of SEND made collages and drawings showing their imagined futures, resulting in 30 artworks and transcripts of audio recordings of 18 meetings and workshops. In this tutorial I will focus on the analysis of this data, which was conducted with a group of 11 participants who chose to stay on as co-researchers.
I am a qualified teacher of the deaf and art psychotherapist, which gave me confidence to experiment with a variety of approaches to see which work well in an arts-based research context. However, these activities do not require specialist art skills, focusing on the process not the product, but whilst interested researchers do not need to be artists, they do need an affinity with the art form being used (Thomson, 2008). Butler-Kisber suggests a middle ground between those who think that “anyone who wishes” can give it a go, and the “somewhat elitist view” that ABR is only for artists, proposing that anyone keen to use art in research can, but should develop the necessary skills first (Butler-Kisber, 2017, p. 5). In addition, I suggest that they could support research with any group at risk of being marginalised by academic language, and could be adapted for a range of contexts by any such researchers who are open to embracing uncertainty and have “faith that the process of creation will carry us through” (McNiff, 1998, p. 35).
Ethics
Prior to the analysis process presented here, initial university ethical approval had allowed planning meetings with co-researchers. As the co-researchers shaped the next stages of the process, the ethics application was amended. Information sheets and consent forms were adapted from those devised as part of the Humanising Healthcare project, with accessible text and photosymbols (Bottomley et al., 2024). I made explicit co-researchers’ right to withdraw at any point (Dockett et al., 2009) and paid close attention to my “ethical radar” (Skanfors, 2009) to acknowledge non-verbal refusal (Truman et al., 2021) such as yawns and avoidance, striving for a form of embodied and ongoing consent (Pluquailec, 2018). It is hard to explain what being a co- researcher in a data analysis process will involve, meaning the necessary “informed” aspect of “informed consent” (Truscott & Benton, 2024) can be hard to achieve. Offering initial analysis activities allowed co-researchers to try out the role without overcommitting, and withdraw by not choosing to come again, making this easier for those who might find it hard to say no (Gray & Winter, 2011). I discussed transparently with co-researchers the current growth in expectation that co-researchers should be paid for their time, but that paying researchers also raises ethical dilemmas (MacKinnon et al., 2021). Co-researchers stressed they enjoyed the activities and did not require payment, but appreciated token gestures like refreshments and taking home items they made, a benefit of the use of ABR, although I acknowledge that co-researchers gave significant time for free and this might be inappropriate in some contexts (Alderson & Morrow, 2011). Co-researchers also proposed solutions to ethical matters that arose in the analysis process, such as potential breaches in confidentiality, demonstrating that young co-researchers themselves can be competent ethical advisers (Chrifou et al., 2025).
Tutorial
In the following tutorial, each activity is presented as a list of instructions, followed by a reflection on the application of this approach in my own research, to illustrate each activity in practice and reflect on its benefits and challenges. I present activities that support introducing key vocabulary, familiarisation with data, sorting and theming data, and distilling and presenting key findings.
Stage 1: Introducing Key Vocabulary
A question at the heart of much participatory research is “Can we find a shared language?” (Pain, 2008, p. 105) and an aim of ABR is to respect other modalities (Thomson, 2008). However, sometimes specific words or concepts will be hard to avoid, leading researchers to find ways to introduce them in enjoyable ways, such as games (Albrechtsen, 2025; Chrifou et al., 2025). In the collaborative visual data analysis described here, whilst striving to avoid jargon (Cashman et al., 2008) words like represent, symbolise and interpretation would be hard to avoid, so an activity to practice using this terminology together was introduced.
Activity 1a: Charm bracelet making activity (Approximately 45 mins)
Aim: Introduce vocabulary in a fun way to prompt a discussion using key terms like representation and symbolism.
-
Buy a charm bracelet kit with a wide range of charms (available from toy shops, hobby and craft stores, and online retailers)
-
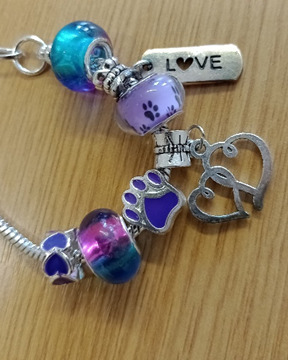
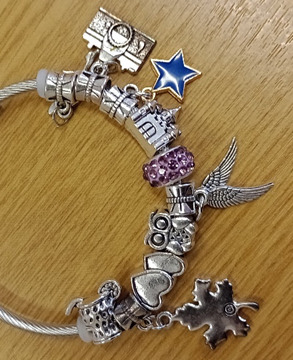
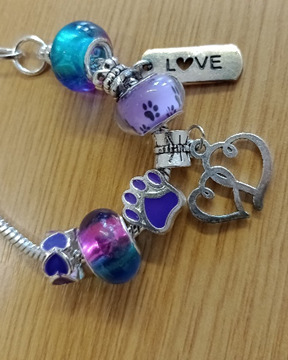
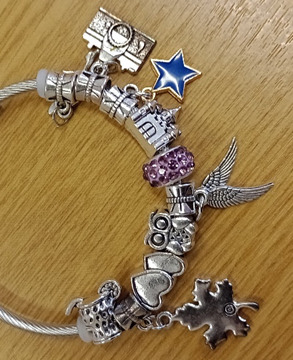
Invite co-researchers to make themselves a charm bracelet to keep (see Image 1).
-
Support co-researchers to choose charms which represent their hopes or wishes (e.g. a heart for love, a paw print for pets).
-
Support co-researchers to choose colours for the band/ bracelet or decorative beads that have a symbolic significance (e.g. green for nature lovers, pink for romance).
-
Invite co-researchers to show their bracelets to the group, and share the charms’ meanings.
-
In group and individual discussions take any opportunity to reinforce terminology that will be useful in the data analysis process (e.g. symbol, symbolism, represent) until you are confident everyone understands the necessary words.
-
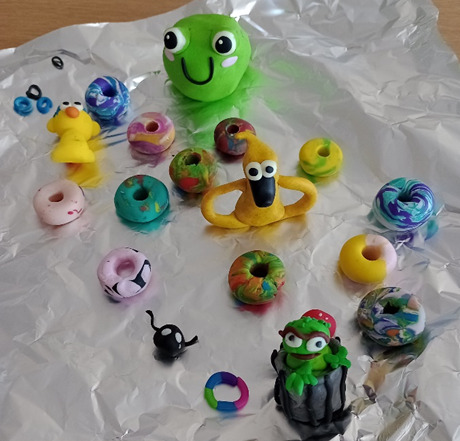
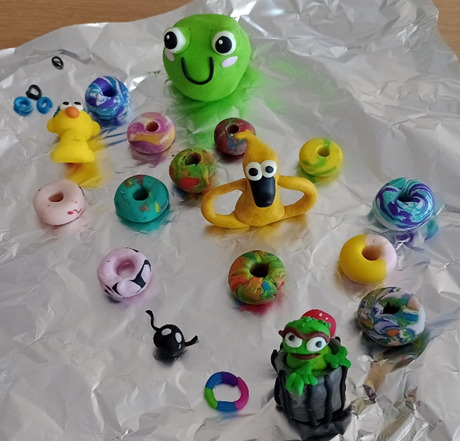
As an optional addition, provide modelling clay for co-researchers to make their own beads and charms specific to their hopes which are not in the kit (see Image 2). Allow time for these to be oven dried, or provide air drying clay.
-
Co-researchers can keep their bracelets as token gestures of gratitude for their time.
Activity 1a in practice
This activity demonstrated that all the co-researchers had an understanding of visual symbolism. For example, one co-researcher used a camera charm to represent an interest in photography but also more broadly a wish to travel the world and see the sights. Using clay to make their own charms and beads allowed for even more individualised responses, for example, one co-researcher made a little basketball, to represent wanting more SEND inclusive sports activities. All co-researchers were able to use the words represent and interpret, but also showed they were able to use their own words to describe symbolism, such as “I used a clover leaf for luck, but it’s got another meaning, because I’m Irish.” The activity created space for us to develop a shared terminology and understanding about what we mean when we talk about the symbolism of visual data. This activity did prompt a discussion about gender, as only girls chose to come to this session. Primrose suggested that boys could make key-rings instead, whilst Consuela said that “Boys get so much stuff” and it was nice to have a session for them. Boys attended all other analysis workshops.
Stage 2: Familiarisation with Data
The ‘data’ in this project was 30 artworks (and accompanying transcripts of art-making sessions) by 21 young people with SEND, some of which had titles or verbal or written explanations by the participants, and some were made by non-verbal participants. I propose that, with some adjustment, these activities could be adapted and used with any visual data, such as photos by participants or researchers, participant timelines, family trees, maps, objects brought in from home etc.
Activity 2a: Create an ‘art gallery’ to display data visually (Approximately 30 mins)
Aim: For co-researchers to begin to familiarise themselves with the data.
-
Before co-researchers arrive, display artworks around the room in the style of an art gallery.
-
Ask co-researchers to take their time to walk round the room and look at the artworks.
-
If appropriate, invite co-researchers to take three deep breaths looking at each picture before moving on to the next (adapted from art critic Ward (2014) who recommends five breaths for adults).
This activity begins the familiarisation stage (Braun & Clarke, 2023) allowing space for first impressions, with “the deliberate intention of looking beyond the norm” (Couceiro, 2024, p. 301). It is important to “allow… time for paused criticism or reflection” (Manguel, 2000, p. 121) and give co-researchers the opportunity to “sit a little more patiently” with the data (Thorburn, Hibbard, et al., 2008, p. 149). A physical art installation encourages “activated spectatorship” (Bishop, 2005) rather than passive observation, as it can be walked around, seen from different angles, touched, and therefore understood differently (Berger, 1972). The gallery activity does not require talking, and can be accompanied by peaceful music. If followed by a discussion, the extra time allowed for reflection first may encourage contributions from co-researchers who benefit from extra thinking time.
Activity 2a in practice
The co-researchers took the activity seriously and looked around the “gallery” in silence, looking carefully at each artwork for 3 seconds, in what felt a very respectful response to everyone’s artwork. Couceiro notes the temptation to jump straight into coding, before taking time to “connect” with the data (2024). Creating time for familiarisation allowed her to “become familiar with the complexities and contradictions within and across” the data (Couceiro, 2024, p. 307). The data gallery also allowed space for a conversation about the importance of wondering about potential interpretations with “reserve and respect” (Beuving & Vries, 2015, p. 171).
Activity 2b: Affective Analysis with Emoji Stickers (Approximately 30 mins)
Aim: For co-researchers to share their affective responses to data.
-
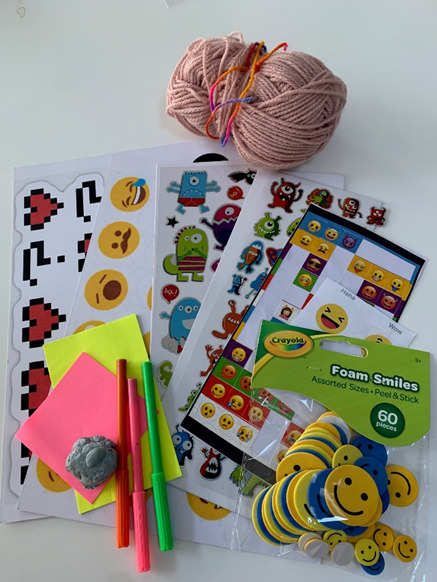
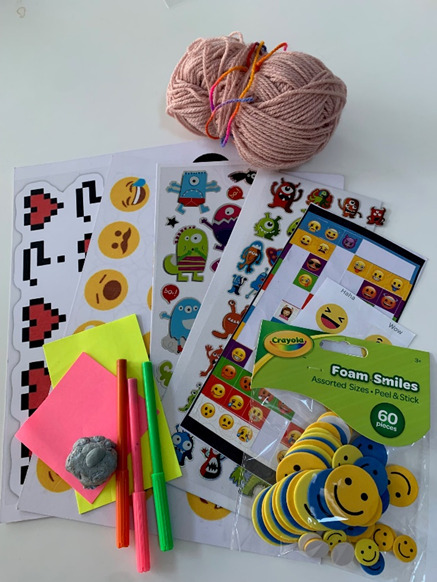
Provide a choice of emoji stickers or similar, to suggest a range of emotions (can be printed onto card or bought online or in discount stores, see Image 3).
-
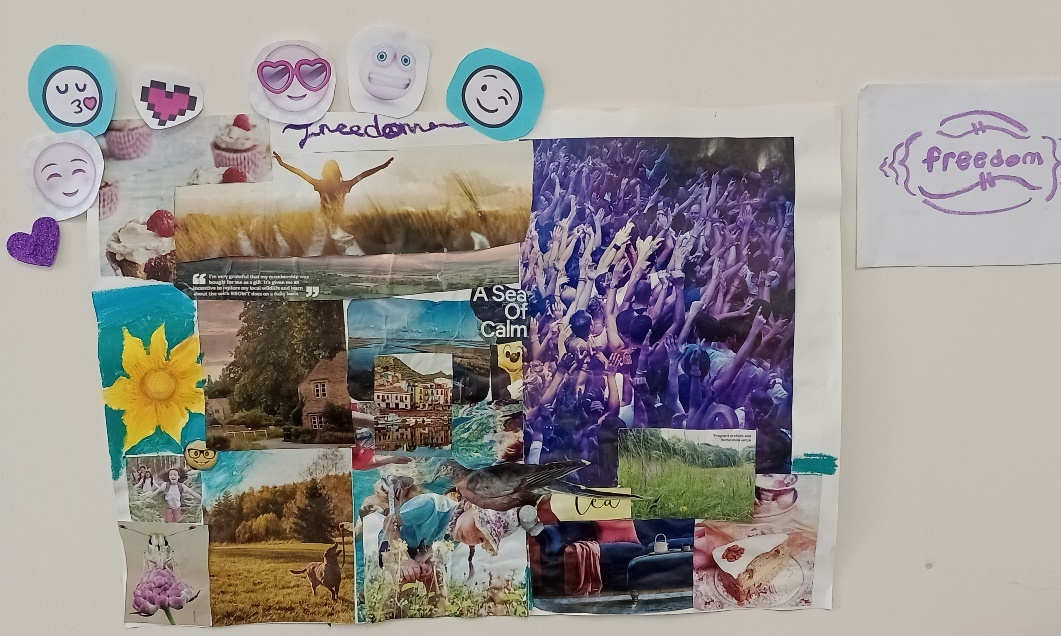
Ask co-researchers to put a sticker next to each artwork, to show their own affective response to it.
-
Clarify that there are no right or wrong answers, and provide post-it notes and pens for co-researchers’ ideas which are not reflected in the available stickers.
-
Invite co-researchers to talk about the reasons for their choices.
This activity creates space for co-researchers to capture, share and value embodied, empathetic and emotional responses to data.. Whilst the initial activity is non-verbal, and photographs of the emoji responses can be used as data, this practical activity can also support co-researchers to contribute to a following conversation, as it offers thinking time and a visual aid to the discussion (Bagnoli, 2009).
Activity 2b in practice
Again, co-researchers did this activity respectfully, adding their emoji stickers without talking. In the photographed example co-researchers used hearts, kisses, and smiley faces, and said the image made them feel happy and peaceful (see Image 4).
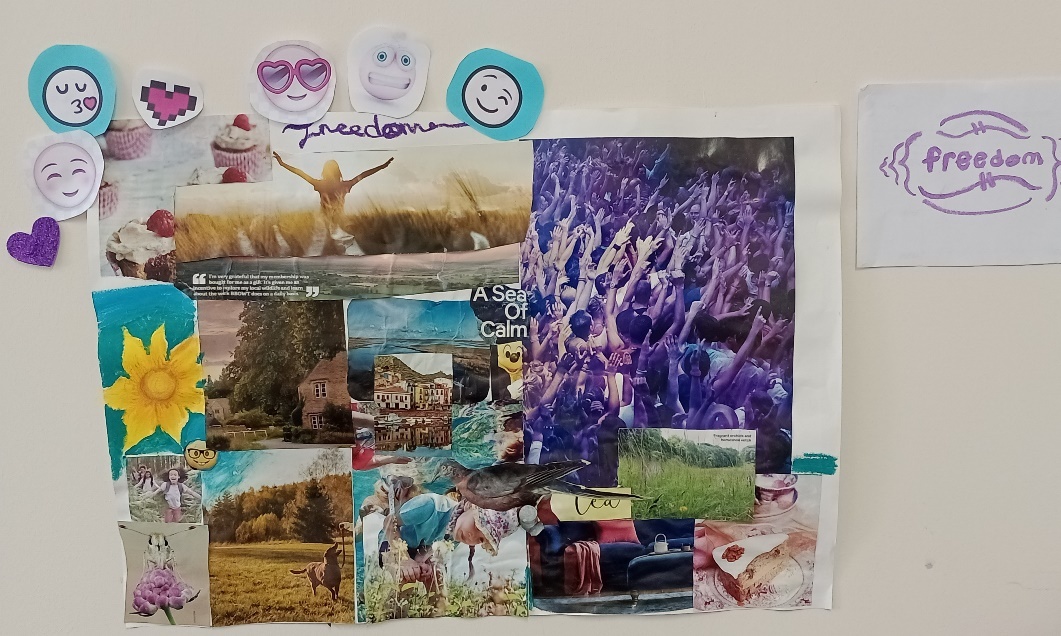
Although the discussion at the end of this activity required co-researchers to talk in a group, a reinstatement of spoken English as the mode of communication which some might find intimidating, it seemed that the practical activity had given them thinking time first (Bagnoli, 2009). All were willing to contribute to the discussion, and their words were supported by the visual responses, for example when a co-researcher with a learning disability had chosen a heart shaped sticker and was then able to explain:
Sally: How did it make you feel?
Zak: Loving and, erm, really sweet, and look like you go round the world.
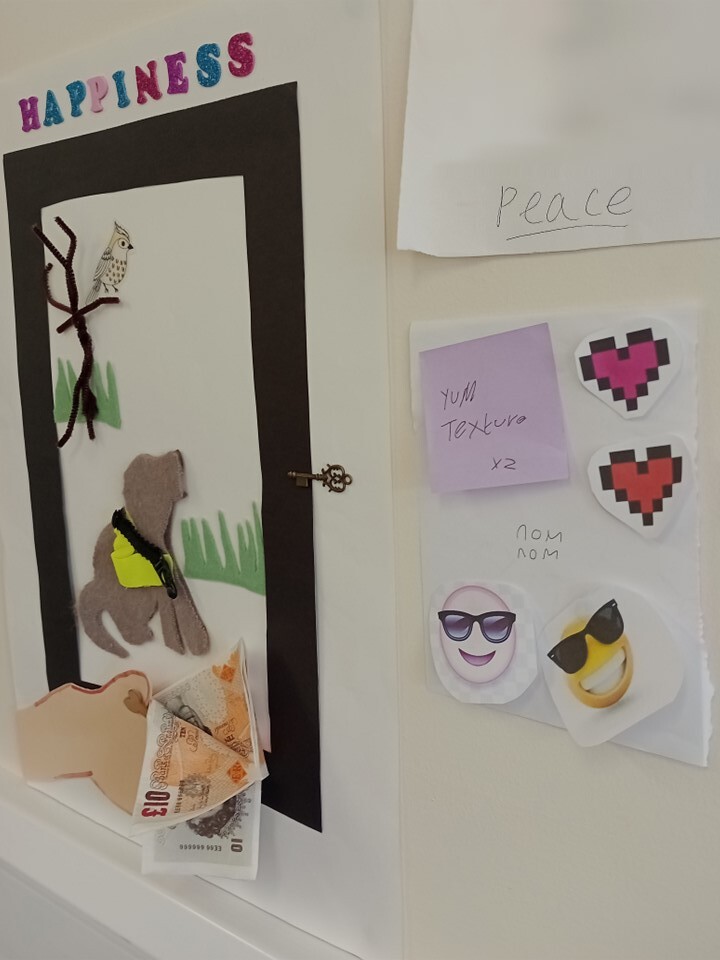
The co-researchers also adapted the activity slightly, taking some post-it notes and adding written comments, but in their own words, rather than the words of the academy, such as “yum texture” and “nom-nom” (see Image 5).
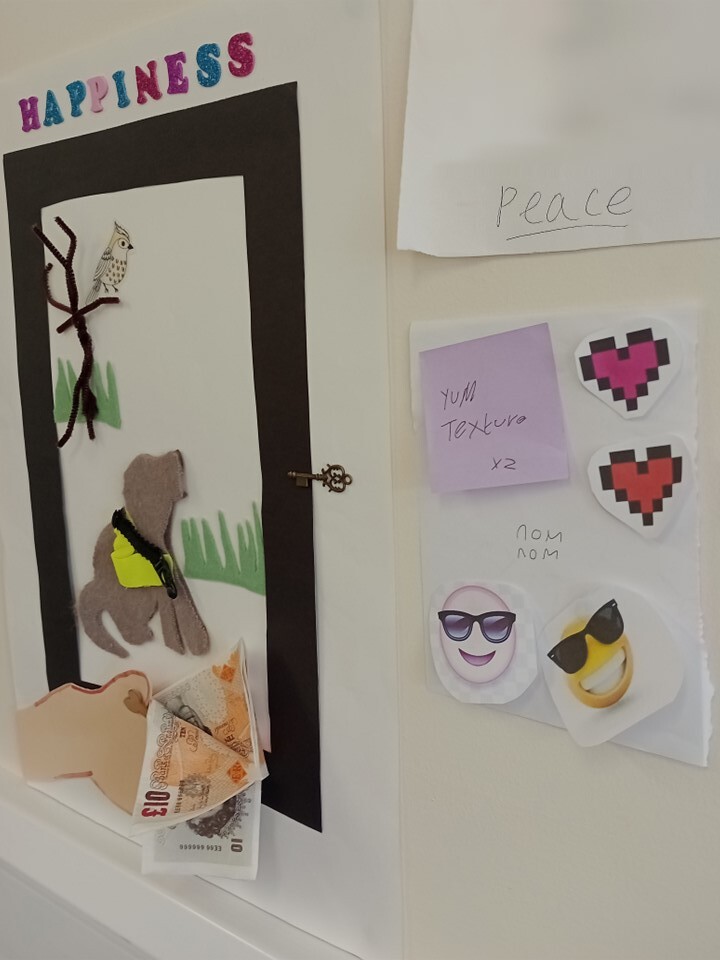
This helped create an environment for analysis workshops in which the language of the co-researchers had equal value to that of the academy. Praising this alternative way of responding showed co-researchers they were allowed to experiment, which I suggest encouraged them to take a leadership role in later activities. Kaplan also observed, discussing a participatory photography project, that young people with SEND seemed to enjoy discussing nuanced understandings and even challenging each other’s interpretations, allowing deeper engagement with the data, but a safe space must be created to enable this (Kaplan, 2008).
Activity 2c: Connect with wool (Approximately 45 mins)
Aim: For co-researchers to begin to identify codes, patterns and themes, making connections between different participants’ data.
-
Ask a co-researcher to take the ball of wool, stand next to a picture of their choice, and suggest a theme in that picture.
-
Ask other co-researchers to look for pictures which share the same theme, or connect to it in some way.
-
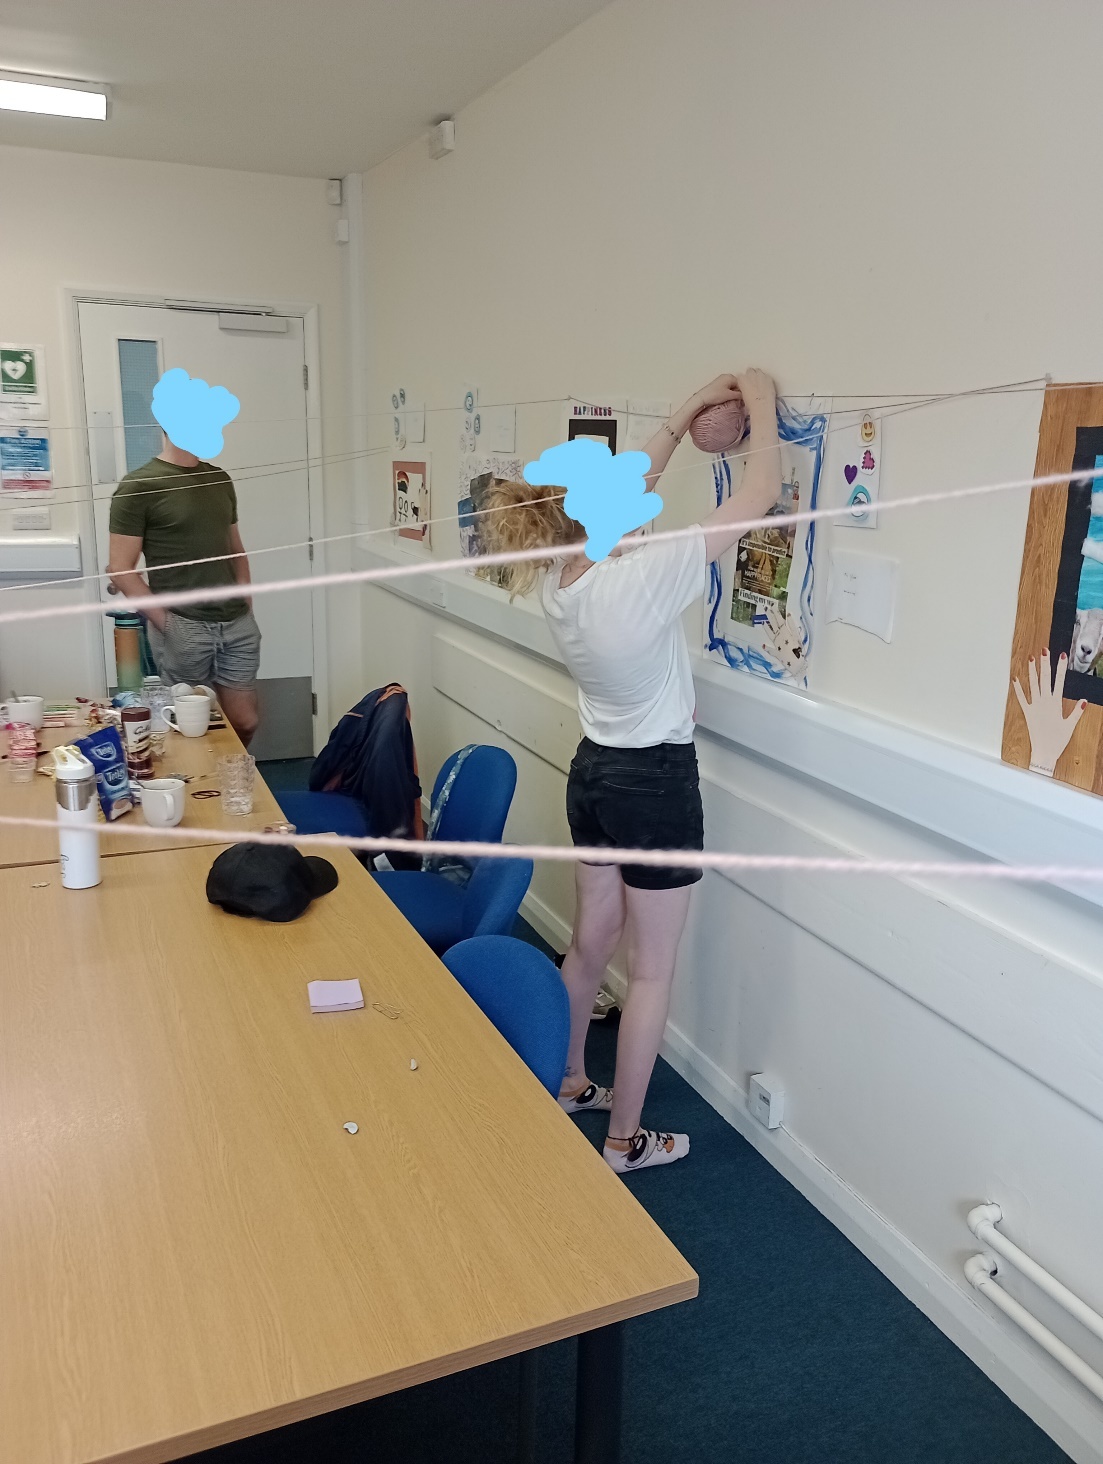
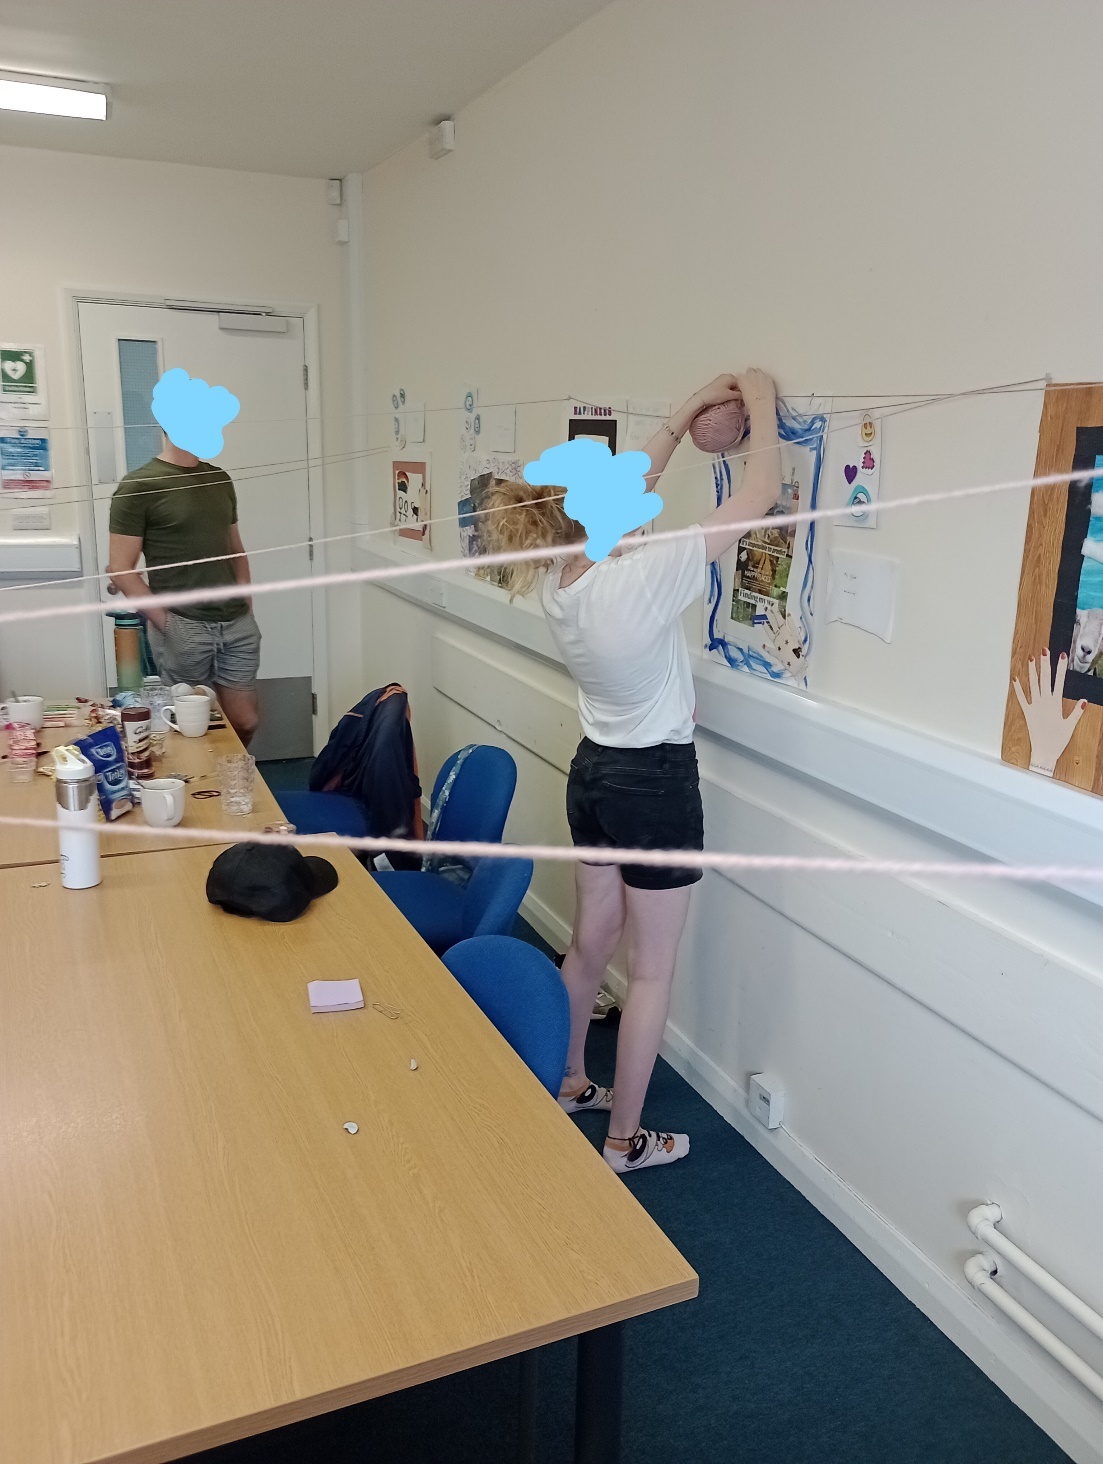
Co-researchers can throw the ball of wall to each other (holding on to their end) to create a physical web connecting pictures with a common theme (see Image 6).
-
Photograph or draw diagrams of the web, to keep as a record of the theme, and the data points it connects.
-
This can be repeated with new starting pictures and new themes (either with a different coloured ball of wool or by winding the first ball back in once the web is finished)
Please note, in this workshop, co-researchers enjoyed ducking under the wool to move about, but this activity might need to be adapted if group members have mobility needs or visual impairments.
Activity 2c in practice
Co-researchers enjoyed the activity which involved much laughter. Co-researchers supported each other and worked together to make connections, including those who lacked confidence in more traditional meetings based on talking alone. Themes identified started simply but became surprisingly complex, as in this example where “healing” was suggested as a theme, which became a very sophisticated connection between multiple artworks:
Bean: So, these people care, yeah? And they’re trying to make a change, yeah? Like… these people are trying to heal the earth…
Shalula: Oh healing!!! With a plaster! [pointing to a different image in which a hand has been scratched by a cat and has a plaster on it to represent resilience]
Everyone: Oooh! [impressed!]
[Bean throws wool to Shalula, who links first picture to cat picture. Zak asks for the wool]
Zak: The link is- like the other one- with like hopes… And sexuality a bit more…
Bean: So, we’ve healed like from the patriarchy’s no, no, you can’t love who you love, we’re healing that.
Faith: Yeah, we’re healing, like, the time that’s been missed.
Zak: It’s like with Pride, people with transgender getting bad…
Shalula: Oh, can I go after you? … Right, I think this one because like if you’re healing, you’re like healing the future to try and make up for, like how we said earlier… maybe the person who made it had too little independence… so going on in life they want to experience independence more… so in that way, they are healing their past future?
Faith: Yeah.
Sally: By reinventing our future, we are healing our pasts?
Shalula: Exactly. You’ve worded that perfect. You said what I meant but I just couldn’t get it out.
The physical interaction with data seemed to support the co-researchers to suggest and elaborate on themes in sophisticated and thought-provoking ways. Some of the co-researchers lacked confidence in their academic abilities (Shalula described herself as “not exam smart”) and the opportunity to work together to find words to explain ideas helped create an environment that felt genuinely collaborative. One co-researcher with a learning disability took a lead in organising other group members, and actively volunteering ideas, and asked their usual youth worker if they could use this activity in future meetings, which suggested he had found it accessible and enjoyable.
Activity 2d: Cardboard box activity to use symbolism to make together (Approx 30 mins)
Aim: For co-researchers to begin to discuss interpretations of possible visual symbolism in artworks. To begin to explore collaborative making.
-
Ask co-researchers to look round the walls at all the initial artworks.
-
Ask co-researchers to identify symbols which might represent specific future hopes.
-
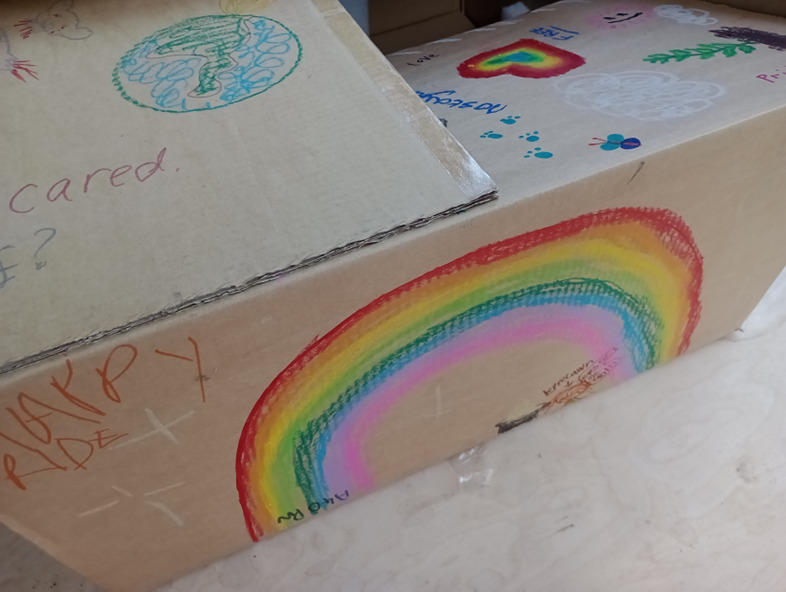
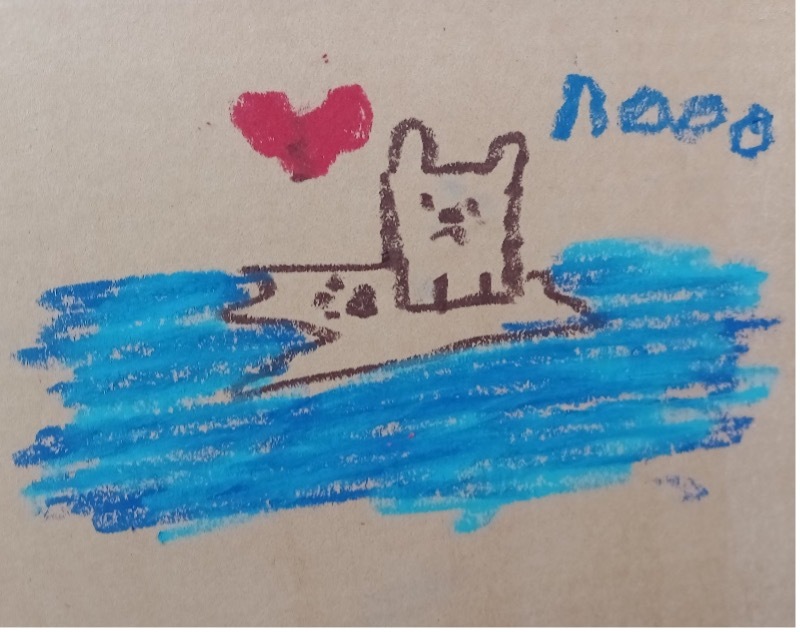
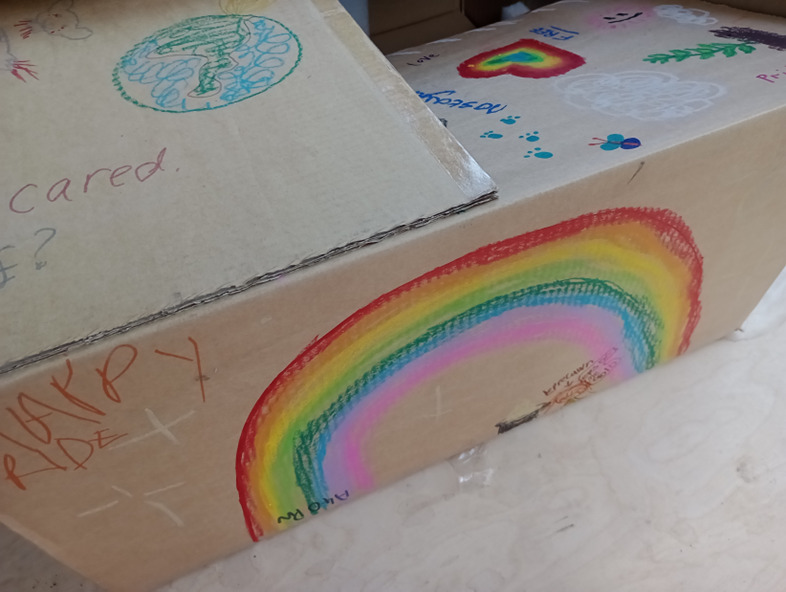
Together, decorate the outside of a large cardboard box with symbols from the data, using drawing, writing or collage (oil pastels give a rich colour on brown cardboard, and modern versions in plastic casings and vibrant colours are appealing to teenagers, see Image 7).
-
While making, facilitate a discussion about possible meanings of symbols and initial ideas about common themes.
-
The inside of the box can be used to explore a contrasting idea- in this case, hopes were put on the outside, and fears on the inside, helping us notice there were less fears than hopes and wonder why, and also to discuss any themes that were not clearly one or the other.
Activity 2d in practice
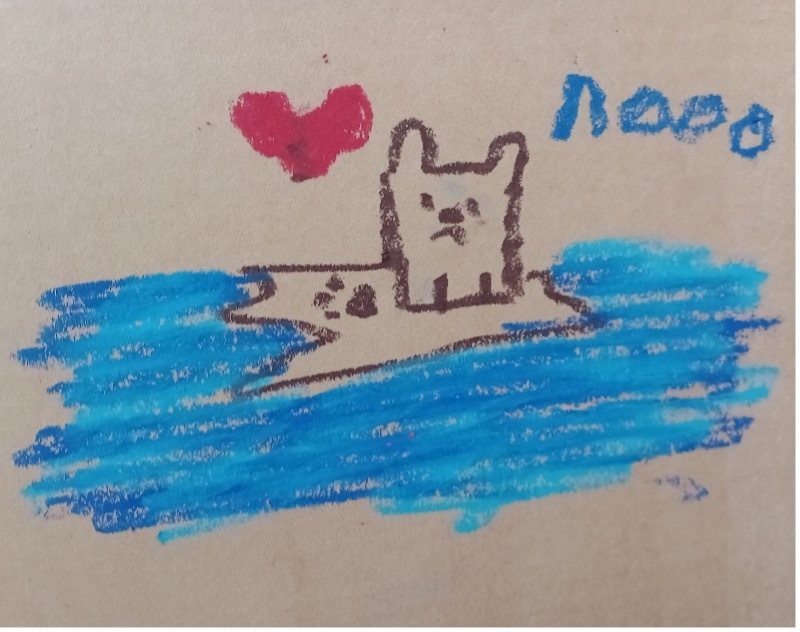
When decorating the inside with fears, co-researchers noticed that the data included far less fears than hopes. It was important to ask co-researchers to look for omissions, and to ask “what they thought was missing” (de Mesa et al., 2024, p. 362). This resulted in a conversation about how the method of asking young people to make an artwork about their imagined future might have encouraged a focus on the positive. The co-researchers then added their own further ideas about fears to the inside (see Image 8). This activity alerted them to the need to look for what is not in the data as well as what is.
Stage 3: Identifying codes and themes, sorting data into themes and sub-themes
The co-researchers themselves suggested that they would like to make lanterns as the final output from the project, which they hoped would be a multisensory celebration of all the participants’ hopes and dreams. Experimenting with lantern design which might incorporate all the original visual data, two initial ideas were trialled and ruled out, before the following activity was devised. However, cutting up and collaging data to create new pieces, each representing a theme, can be applied to any lantern styles, or other objects, such as boxes, or items which suit your research, such as in my current project, in which second-hand clocks are being decorated to represent themes related to temporality. Items to be cut up could be artworks made by participants, as in this example, or photographs, screenshots, maps, school work, diagrams or any range of data that could be cut up to select and sort key points.
Activity 3a: Collage as coding: Identifying key aspects of the data
Aim: Co-researchers identify key aspects of each artwork and discard less important information.
-
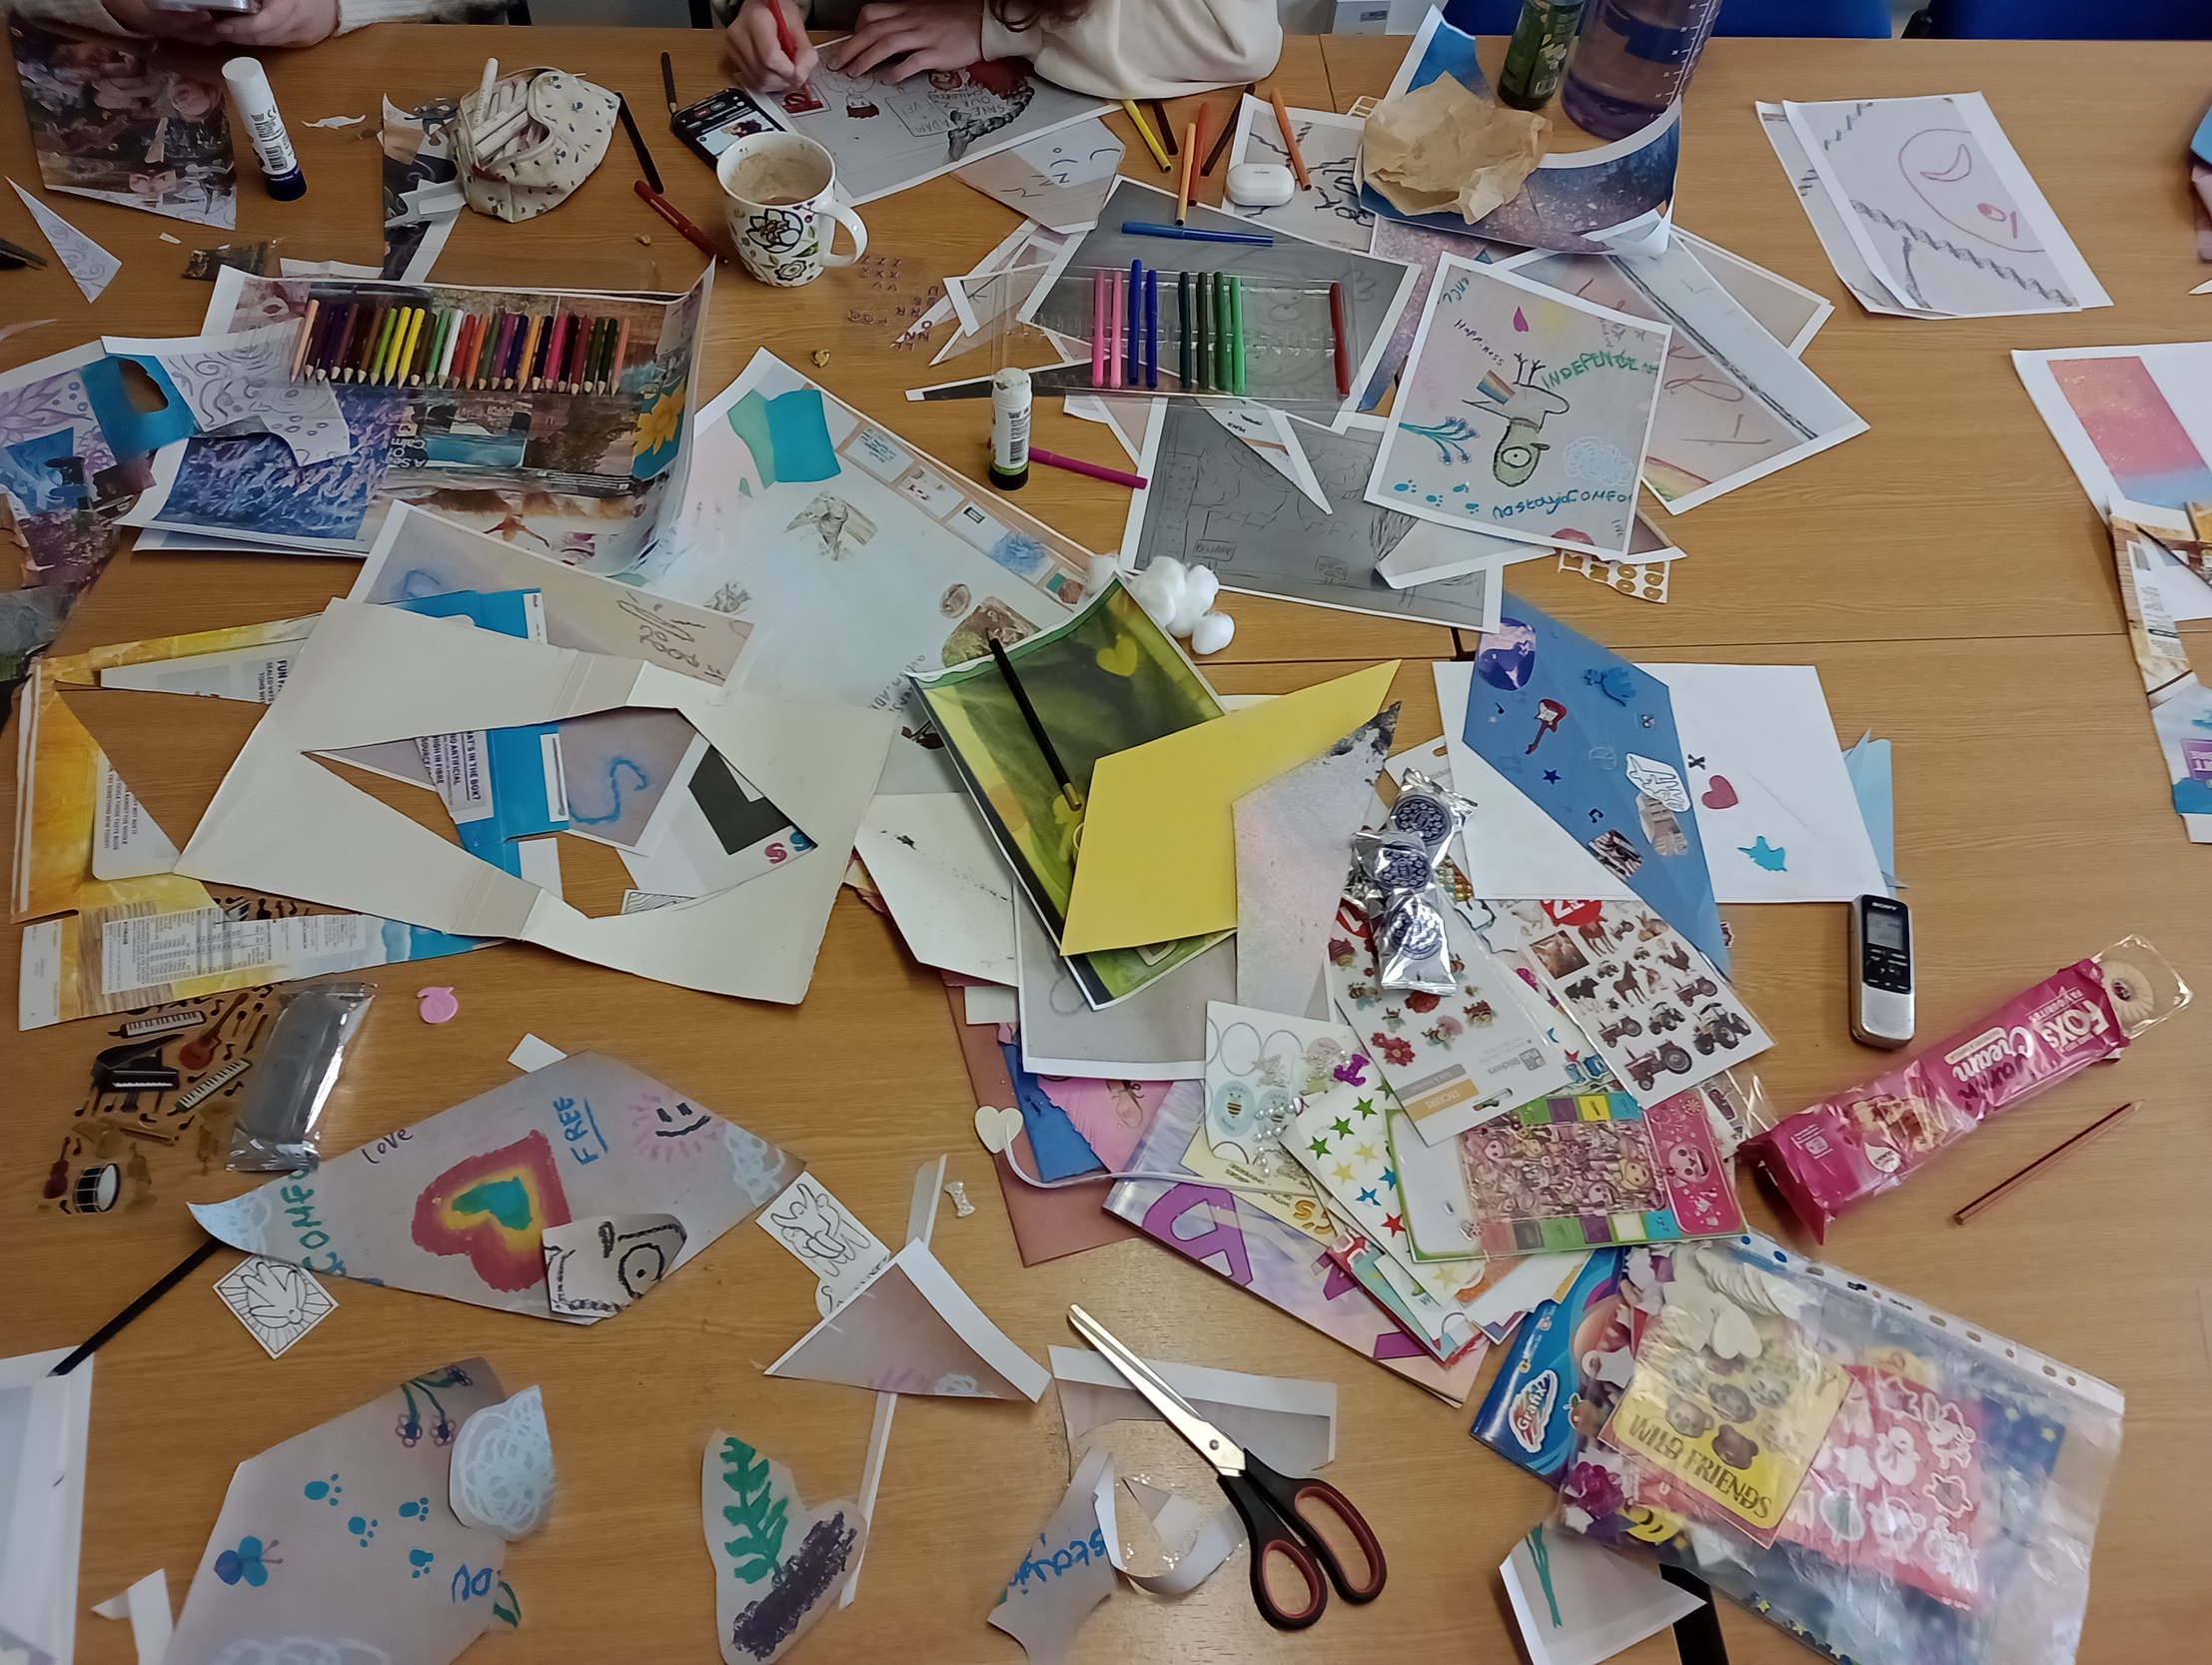
Print colour photocopies of all the data (in this case the images made in the data production stage of the research process) so that originals can be kept safely and/ or returned to the makers.
-
Co-researchers spread out all the copied images on the table.
-
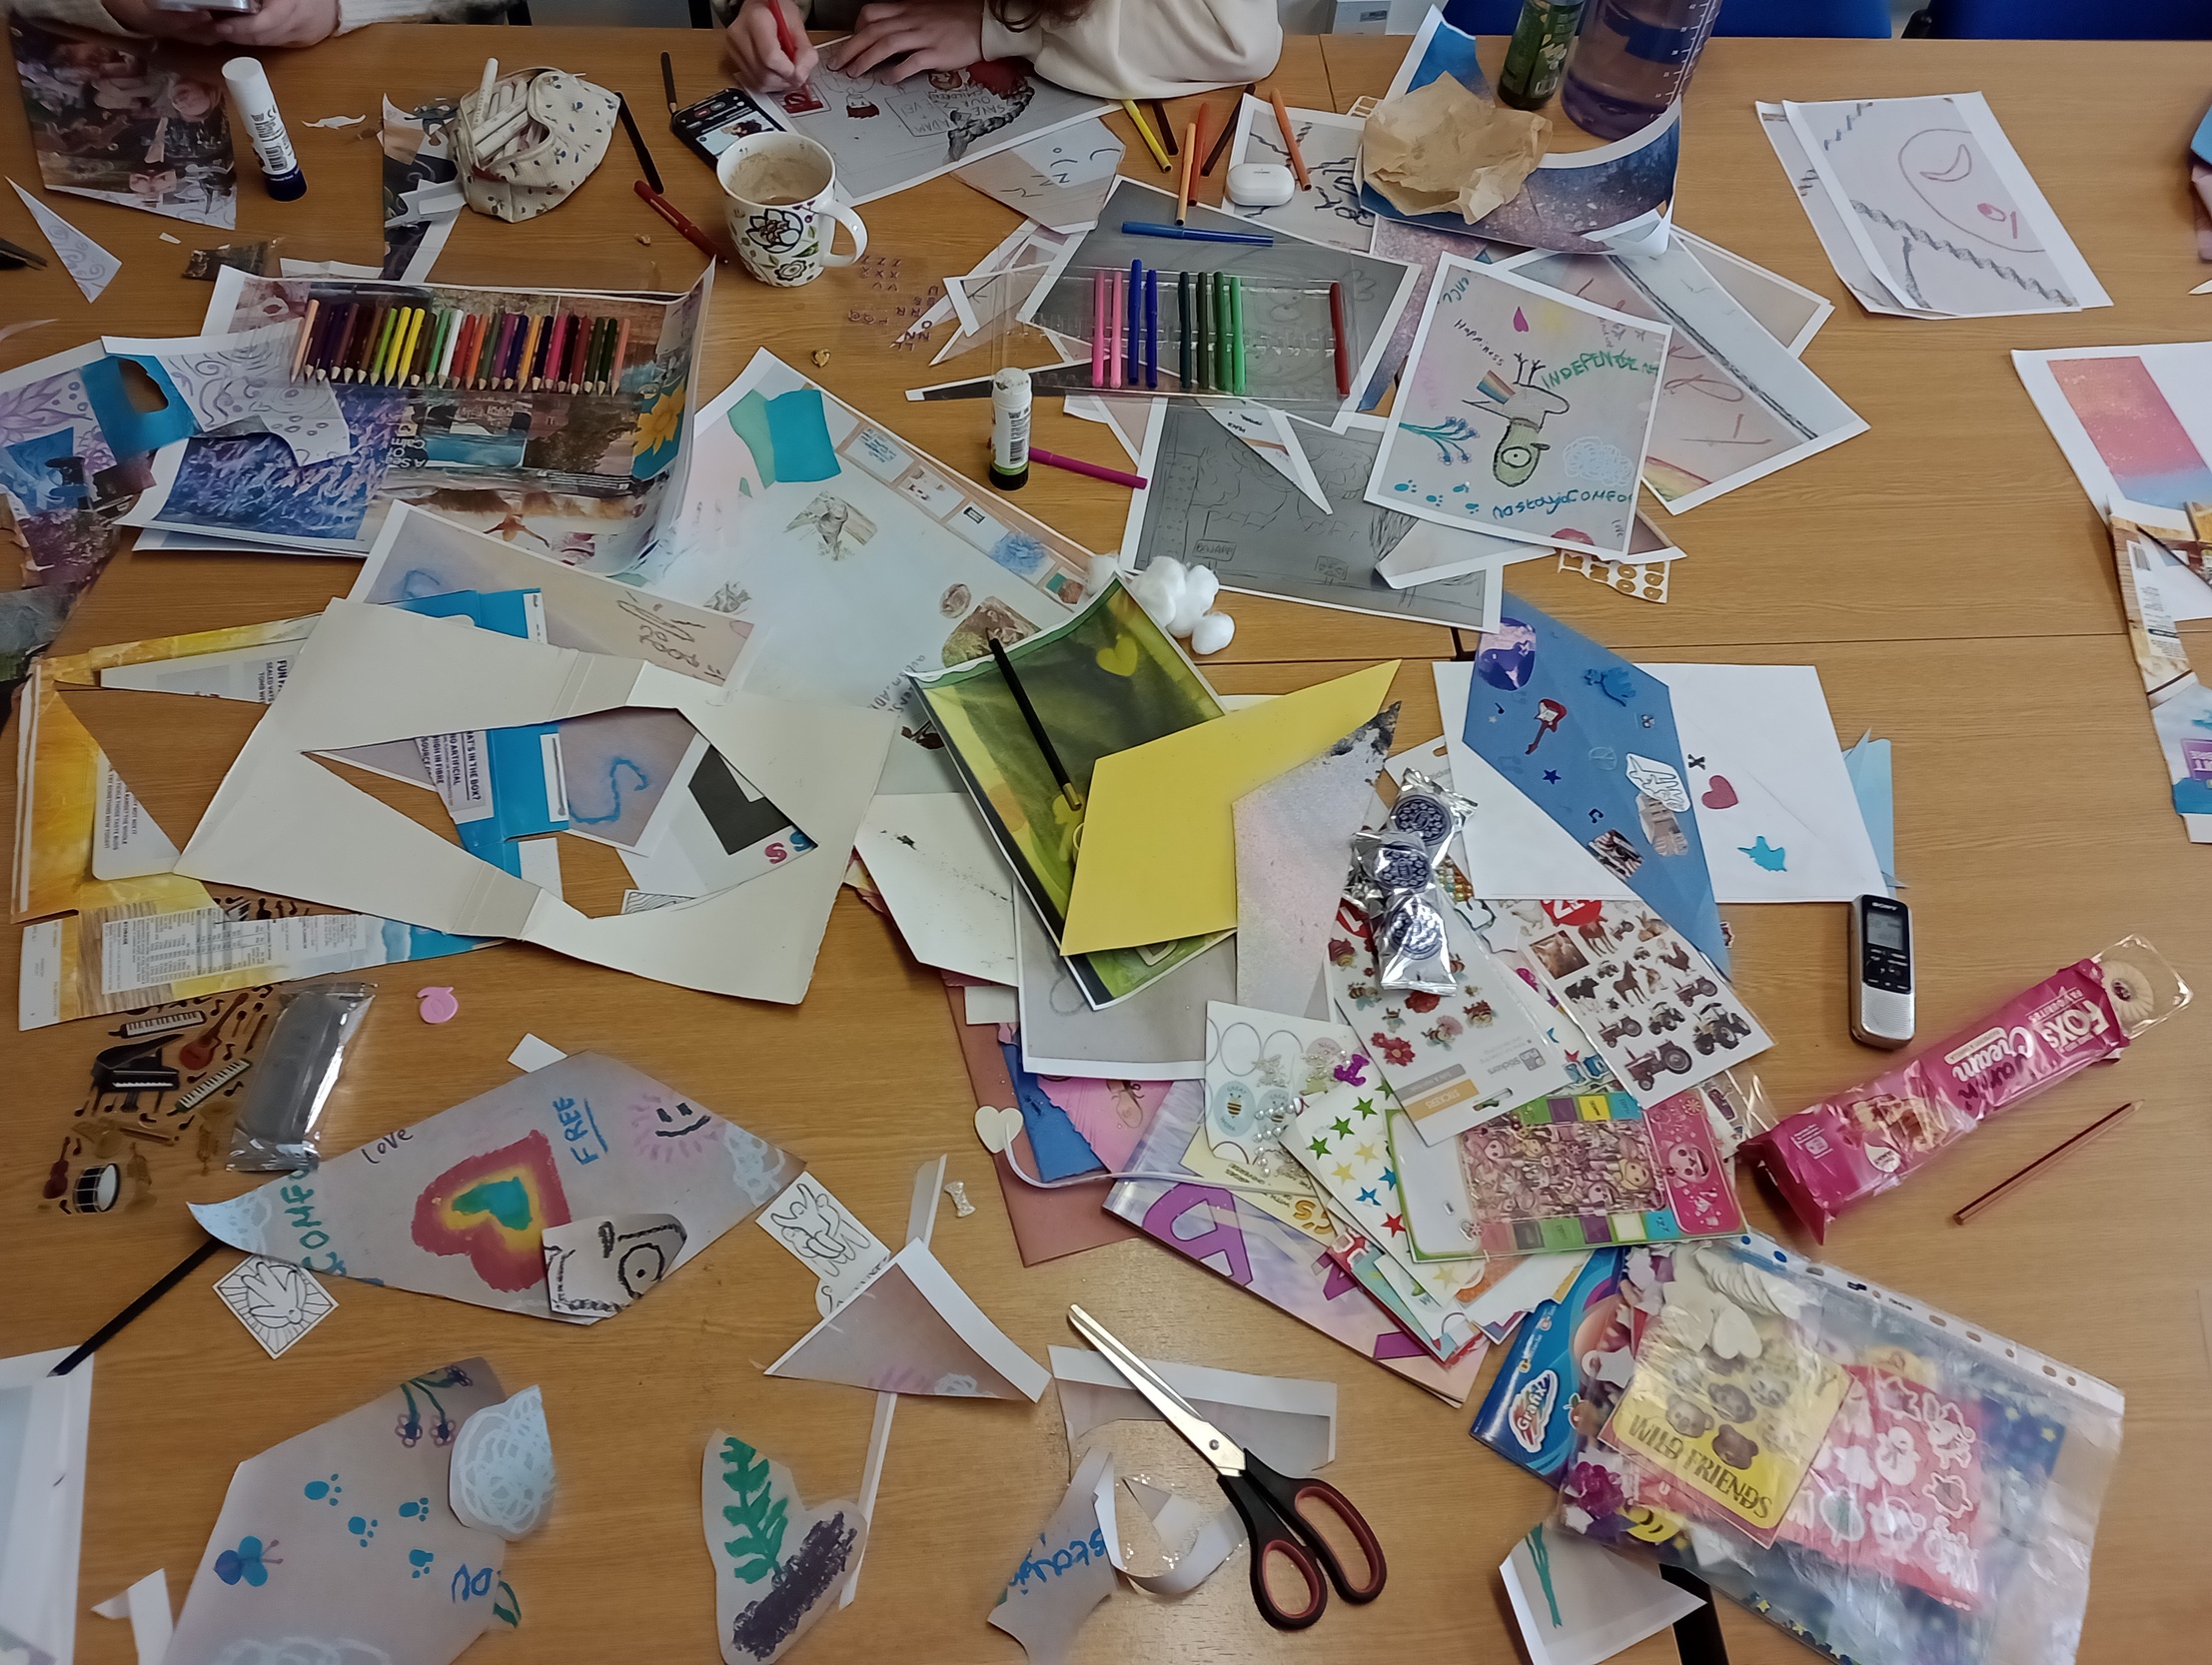
Allow time for initial looking and chatting to re-familiarise with the data.
-
Provide “window” templates (pieces of card with a shape cut out to create a window frame effect). In the example below we used a kite shaped window, as each kite would then fit on one spoke of the star shaped lanterns.
-
Co-researchers place the window template over the artworks, moving them around to select what appears through the window frame, identifying the parts of the data they think are important and should be included in further analysis.
-
Drawing round the inside of the window frame, co-researchers cut out the aspect of the data they have selected.
-
Co-researchers can cut out more than one shape from each picture, if they think more than one thing is important and needs including.
Activity 3a in practice
The young people in the project discussed here were very competent at using the window template to select visual clues which represented key aspects of the data, and, as in the emoji activity and charm bracelet activity, quickly made their own adaptations to the activity, for example by creating a new kite shape by combining aspects from different original pictures, or adding embellishments to draw attention to what they thought was most important.
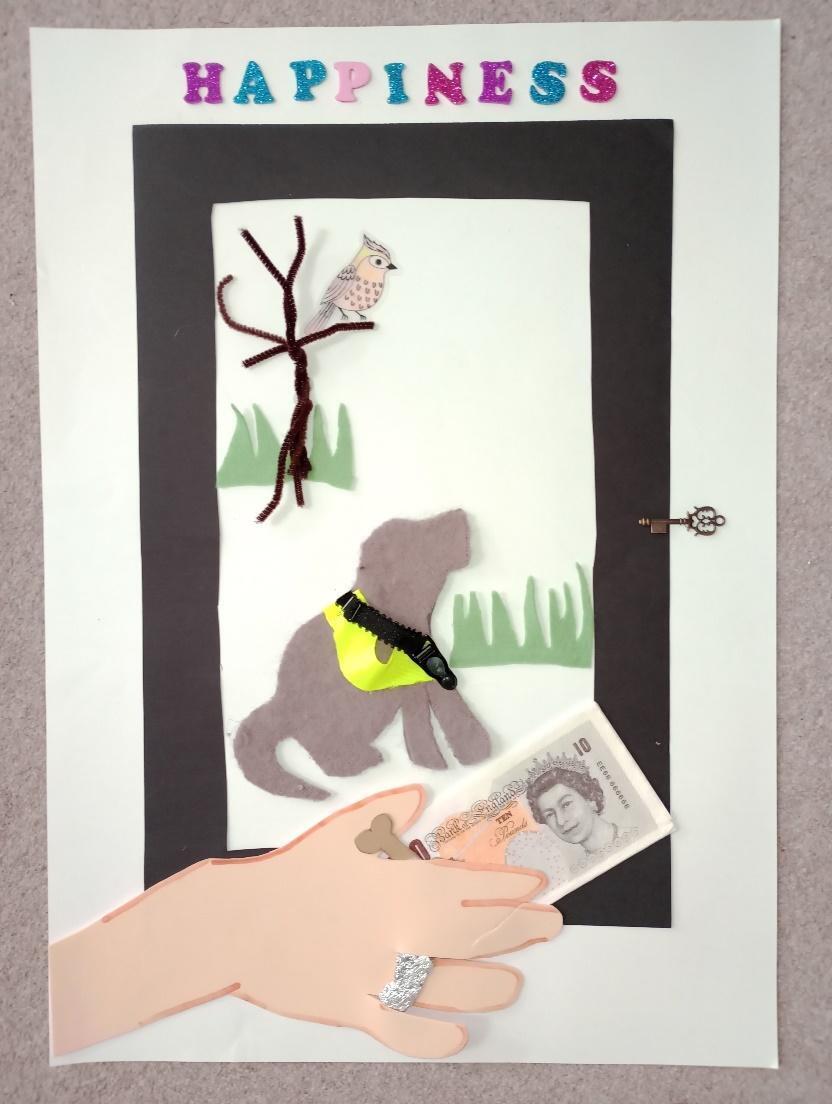
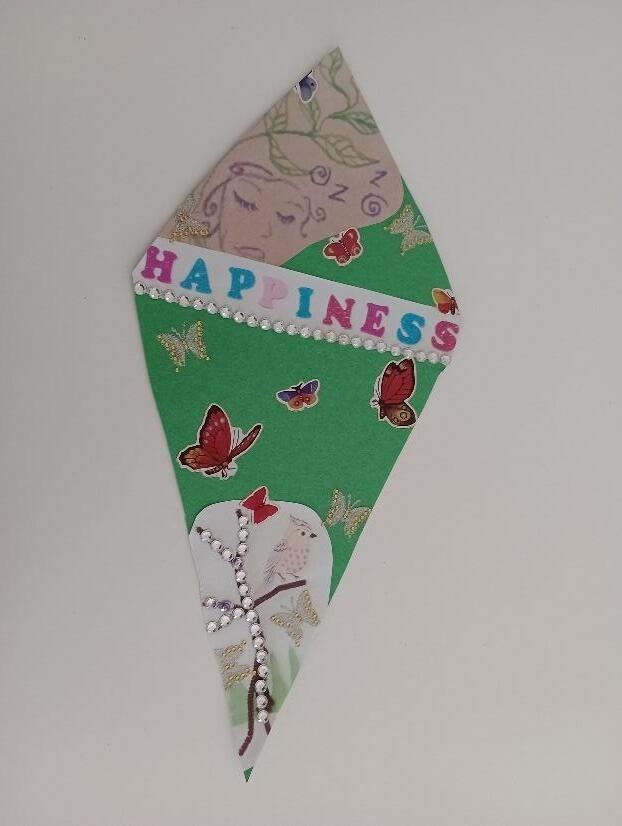
For example, John had created an original artwork, labelled “Happiness” which includes a guide dog, money, a wedding ring, dog biscuit, and locked door (see Image 10). The co-researchers suggested the key message was a future goal of being financially and physically secure, and supported by a partner and guide dog. They also felt the tree, bird and grass represented a link between nature and wellbeing.
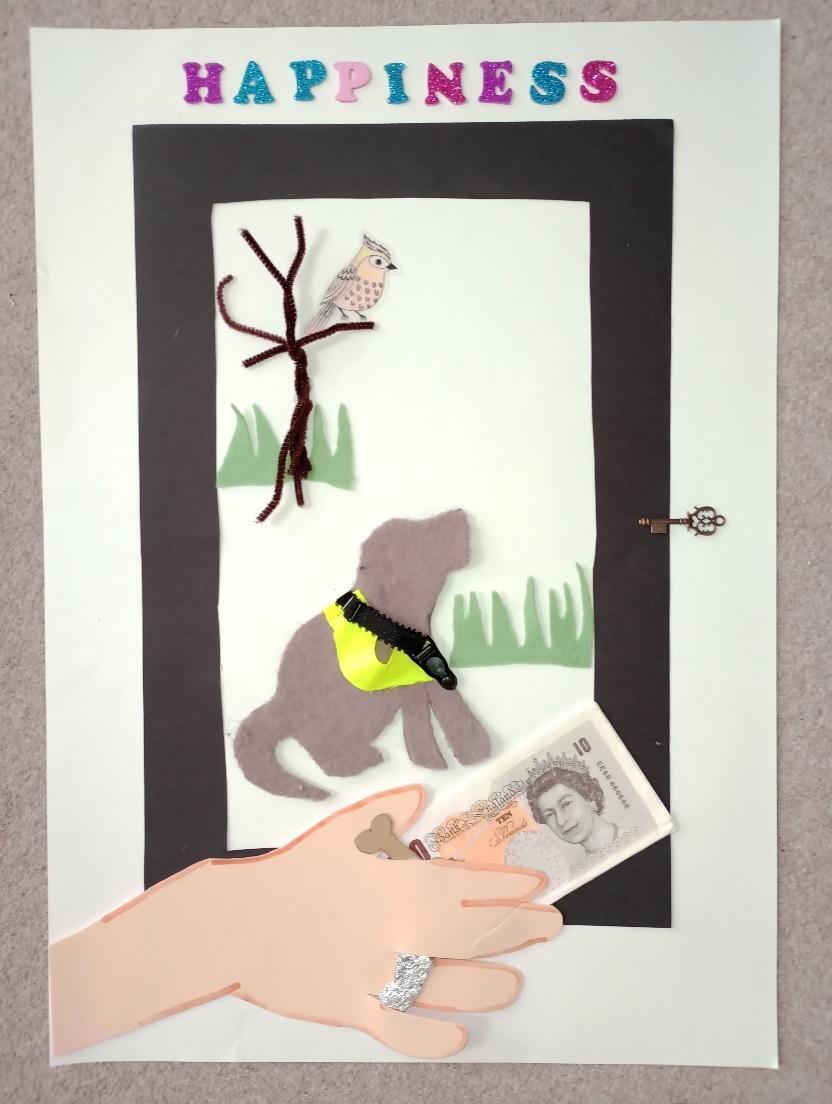
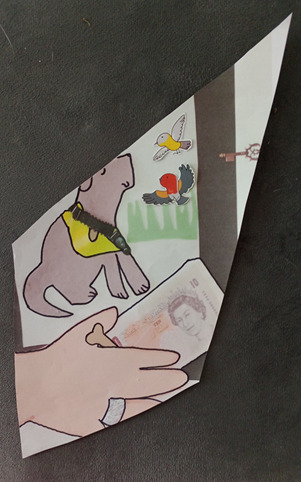
These aspects did not all fit on one kite shape, and the co-researchers turned it into two, whilst still respecting the original artist’s title of “Happiness”: One showed having enough money, marriage, a guide dog and a locked door, which John had identified as key to his future happiness, which the co-researchers labelled “security is important for happiness”. They then took the tree and bird, embellished it, and combined it with part of another participant’s drawing which also focused on nature, labelling it “nature is important for happiness”.
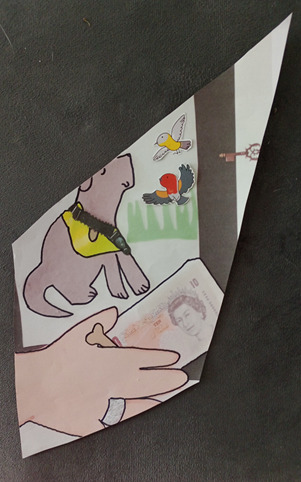
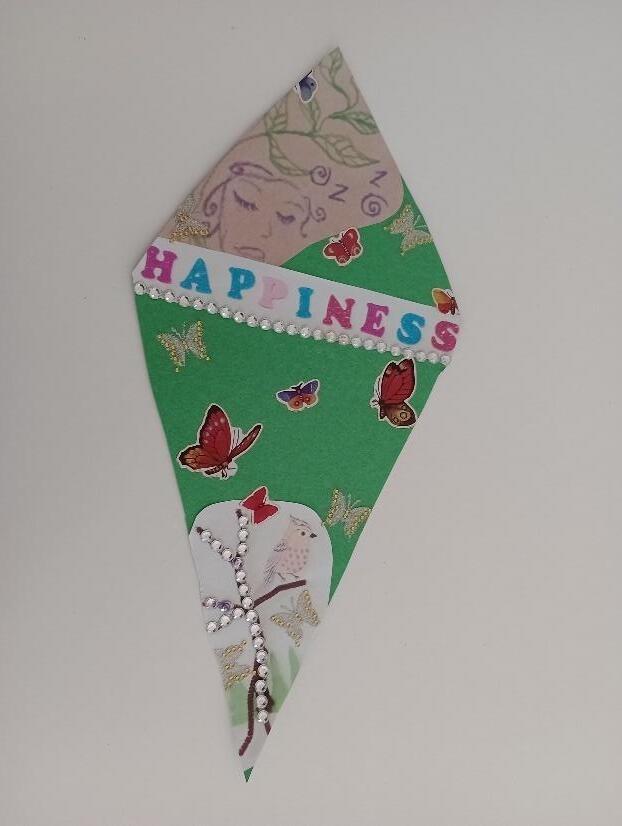
This activity could be considered a form of visual coding, as by separating the data into security and nature (see Images 11 and 12) the co-researchers could be said to be “generating succinct labels (codes!) that capture and evoke important features of the data” (Braun & Clarke, 2023).
Activity 3b: Sorting Kites into Themes (Approximately 45 mins)
Aim: Co-researchers suggest themes and begin to sort data into thematic groups.
-
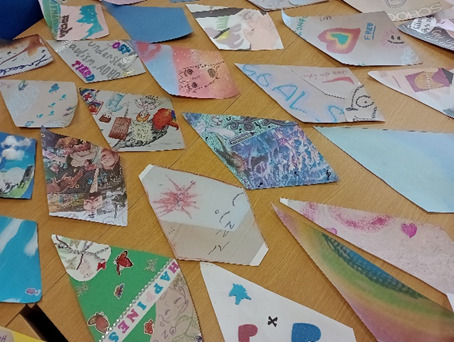
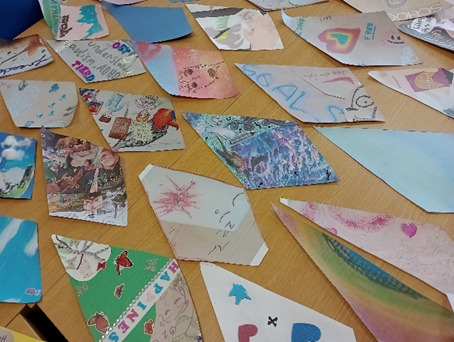
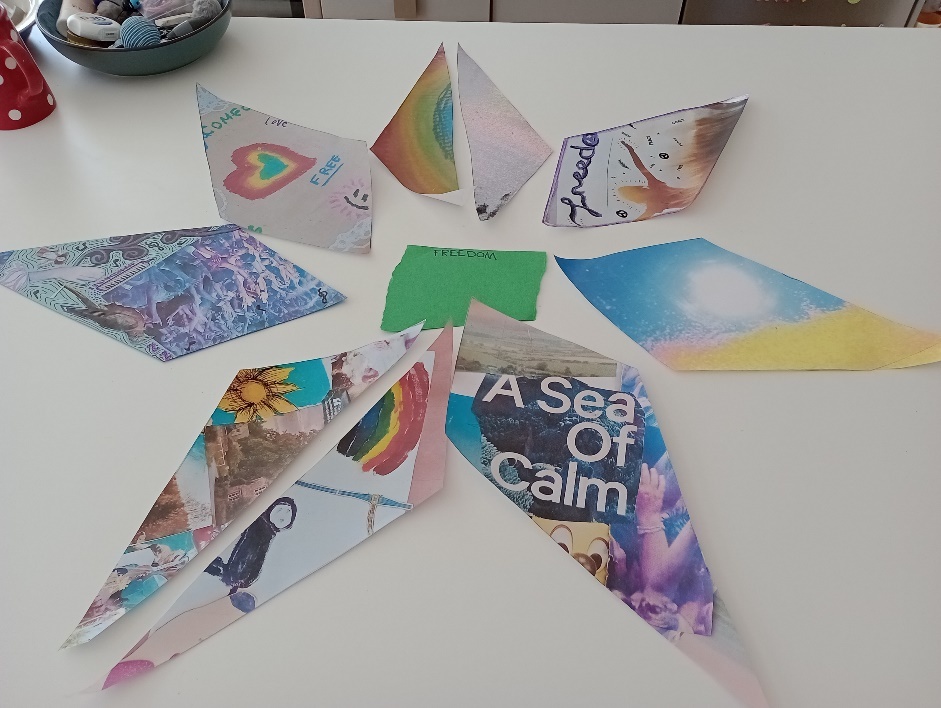
Co-researchers spread all the selected pieces of data out on a table- in our example the 30 original artworks made 49 kite shapes (see Image 13).
-
Co-researchers work together in small groups to start physically moving the kite shapes around the table, suggesting comparisons, juxtapositions, or what they may have in common, which may become themes.
-
Co-researchers move the kites around as they change their minds and develop and refine themes and sub-themes.
-
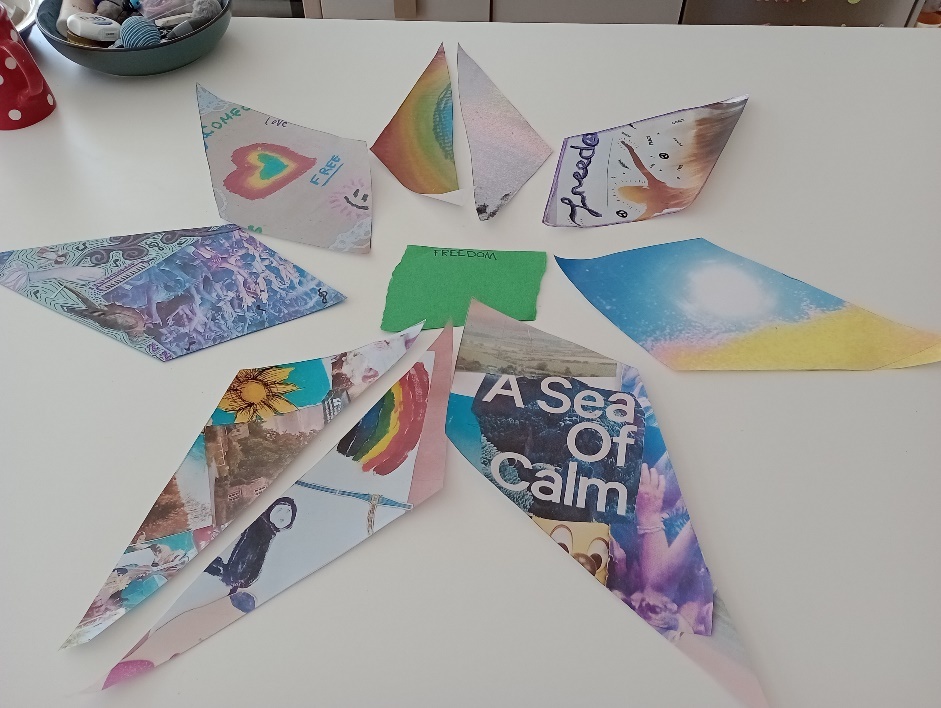
As they agree on the names of thematic groups, co-researchers write these on paper labels and begin to group images together under those themes- again they can change these as they go along (see Image 14).
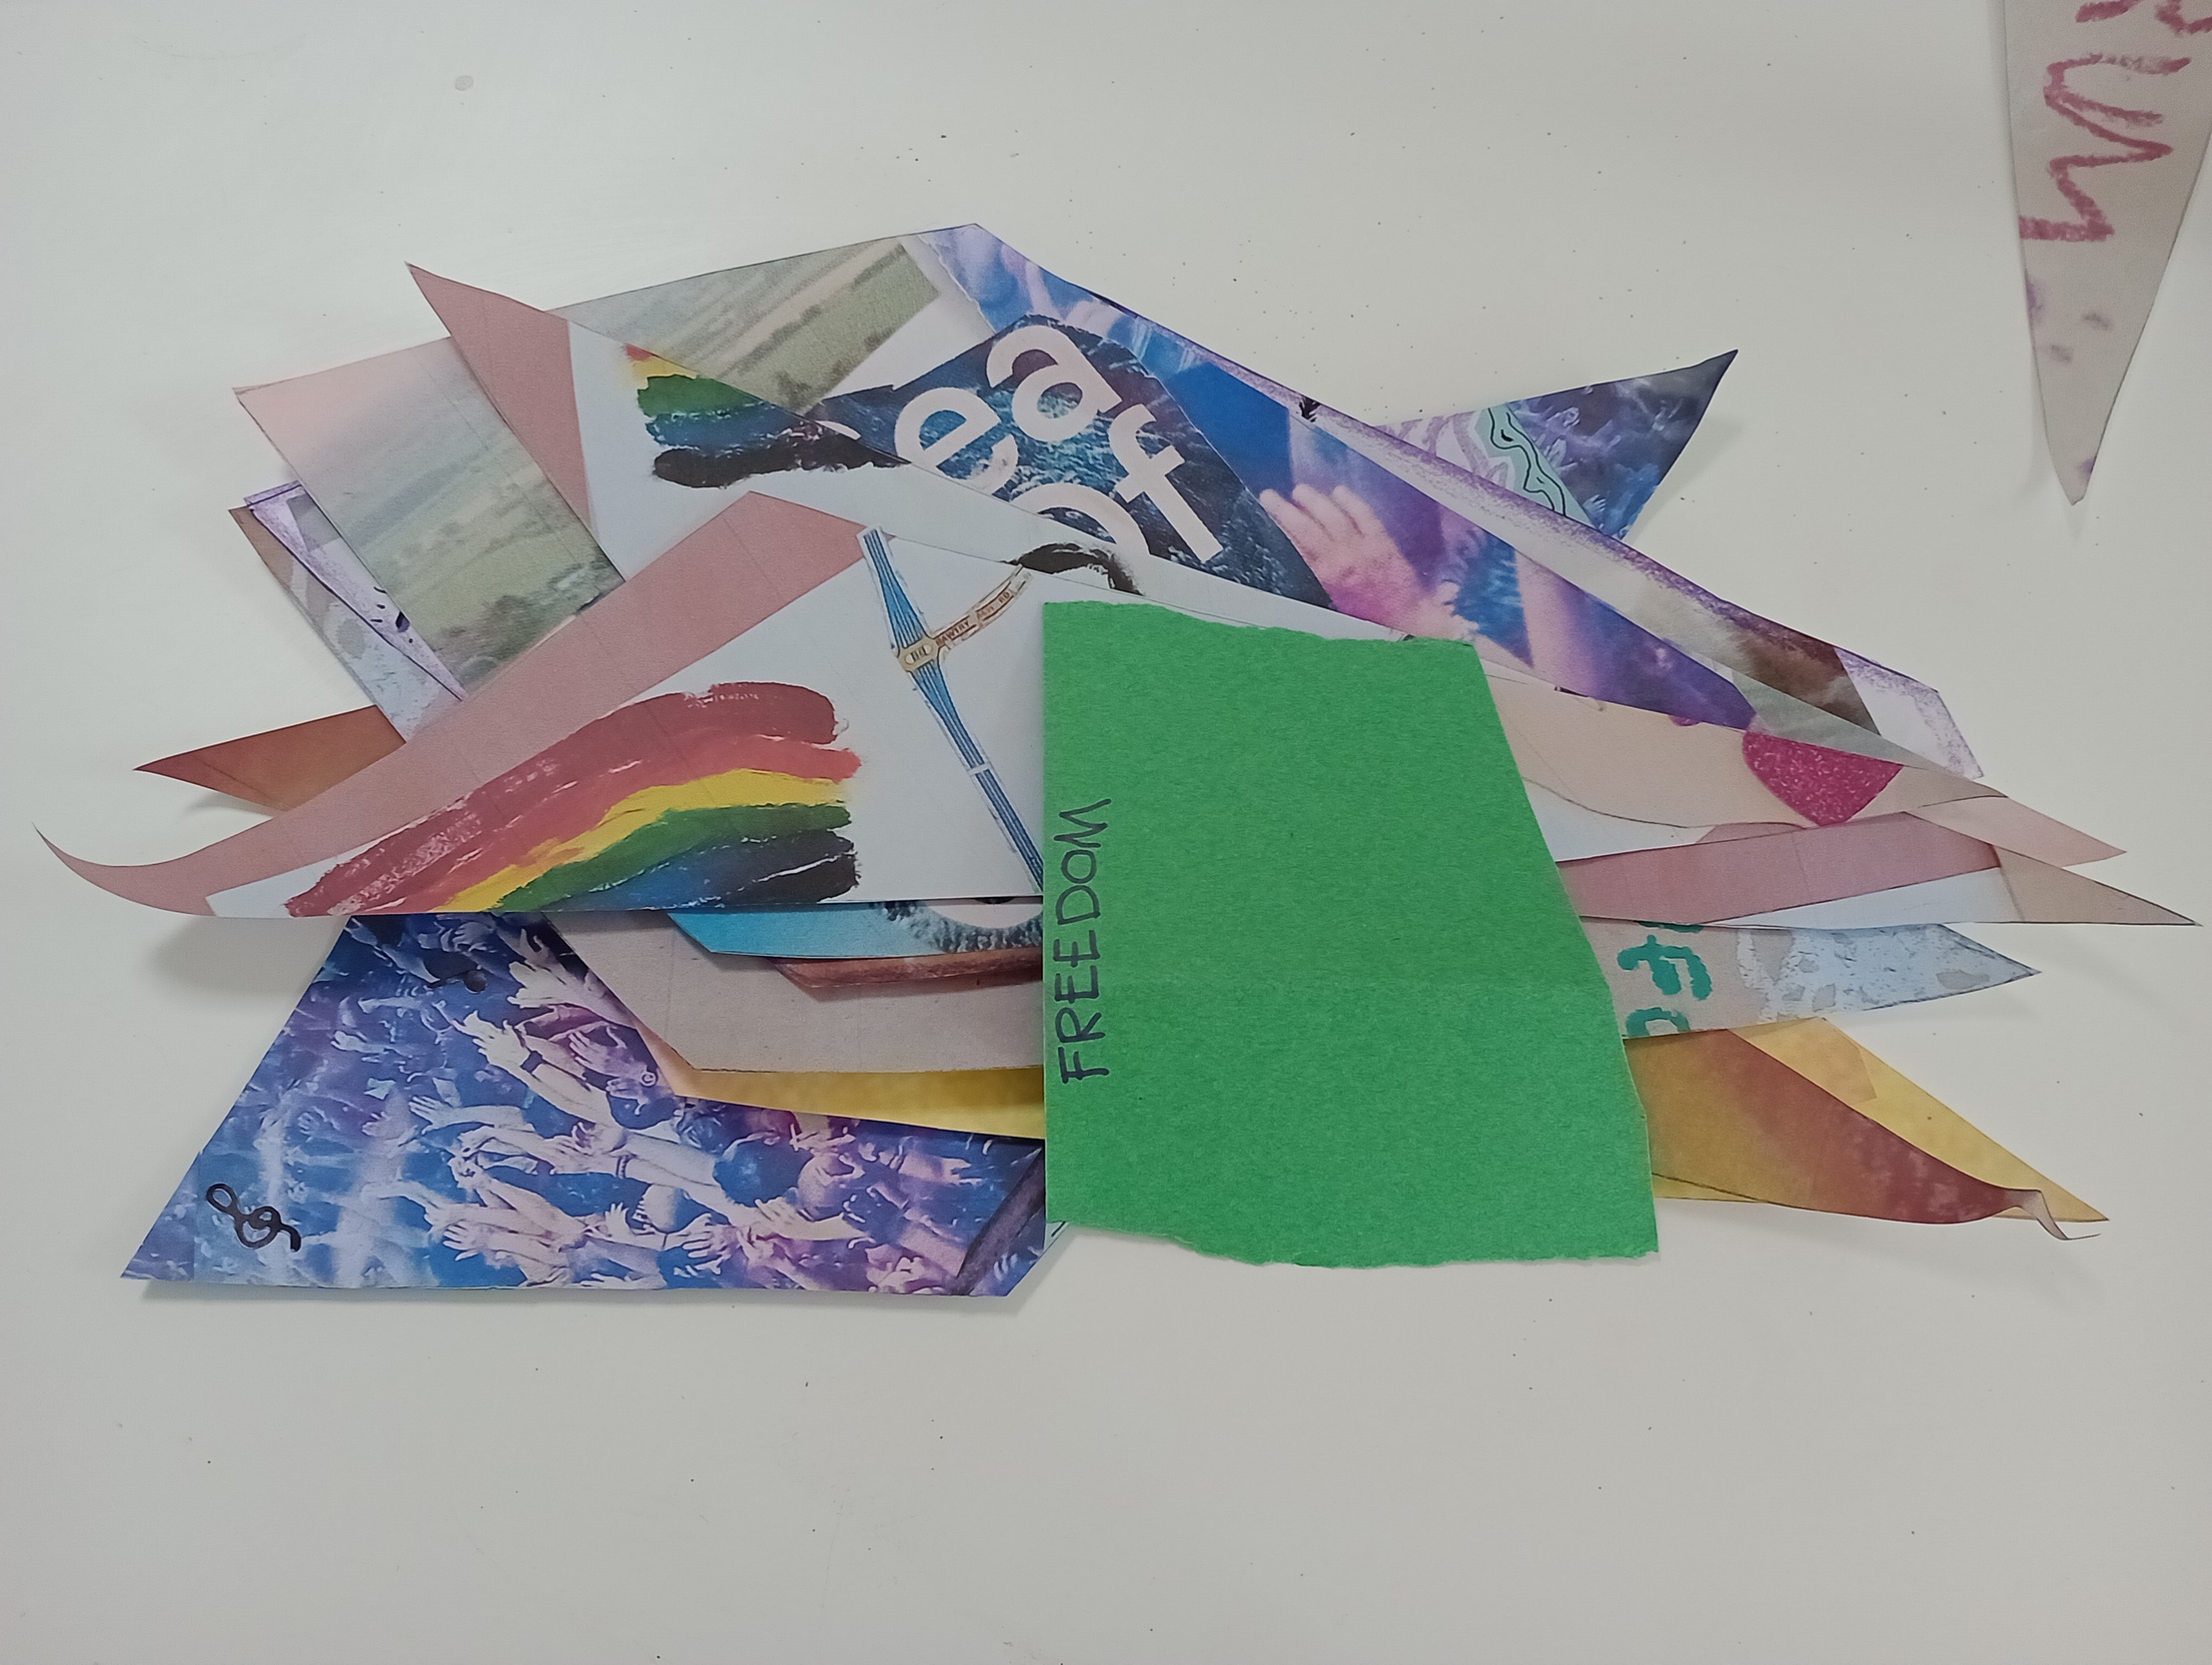
- Co-researchers continue to confirm and refine the themes chosen.
Activity 3b in practice
The co-researchers in this example began with some initial moving about of the kite shapes and suggesting of connecting words. They needed very little instruction or encouragement, perhaps because this was the third workshop and they had built up relationships and confidence. They quickly began moving shapes and suggesting themes:
Shalula: I think…happiness. That’s definitely a key thing. Like that, and like that and stuff (pointing to examples). But also like the negatives of what the future could be like.
Faith: I think there’s quite a lot of erm- worry- in some of them.
Shalula: Absolutely.
Faith: I’ll pick out worries.
Shalula: I’ll pick out happy.
They realised the themes needed refining, as the theme of happiness was too large, and began to suggest sub groups, which gradually became the names of the final themes:
Rose: Could ‘Freedom’ be itself and then ‘Happiness and Goals’ be one?
Shalula: Erm, this looks quite happy?
Rose: Shall I put it for ‘Freedom’?
Shalula: Yeah. No, ‘Goals’. Er, ‘Goals’… I don’t know.
Rose: What about ‘Freedom and Creativity’?
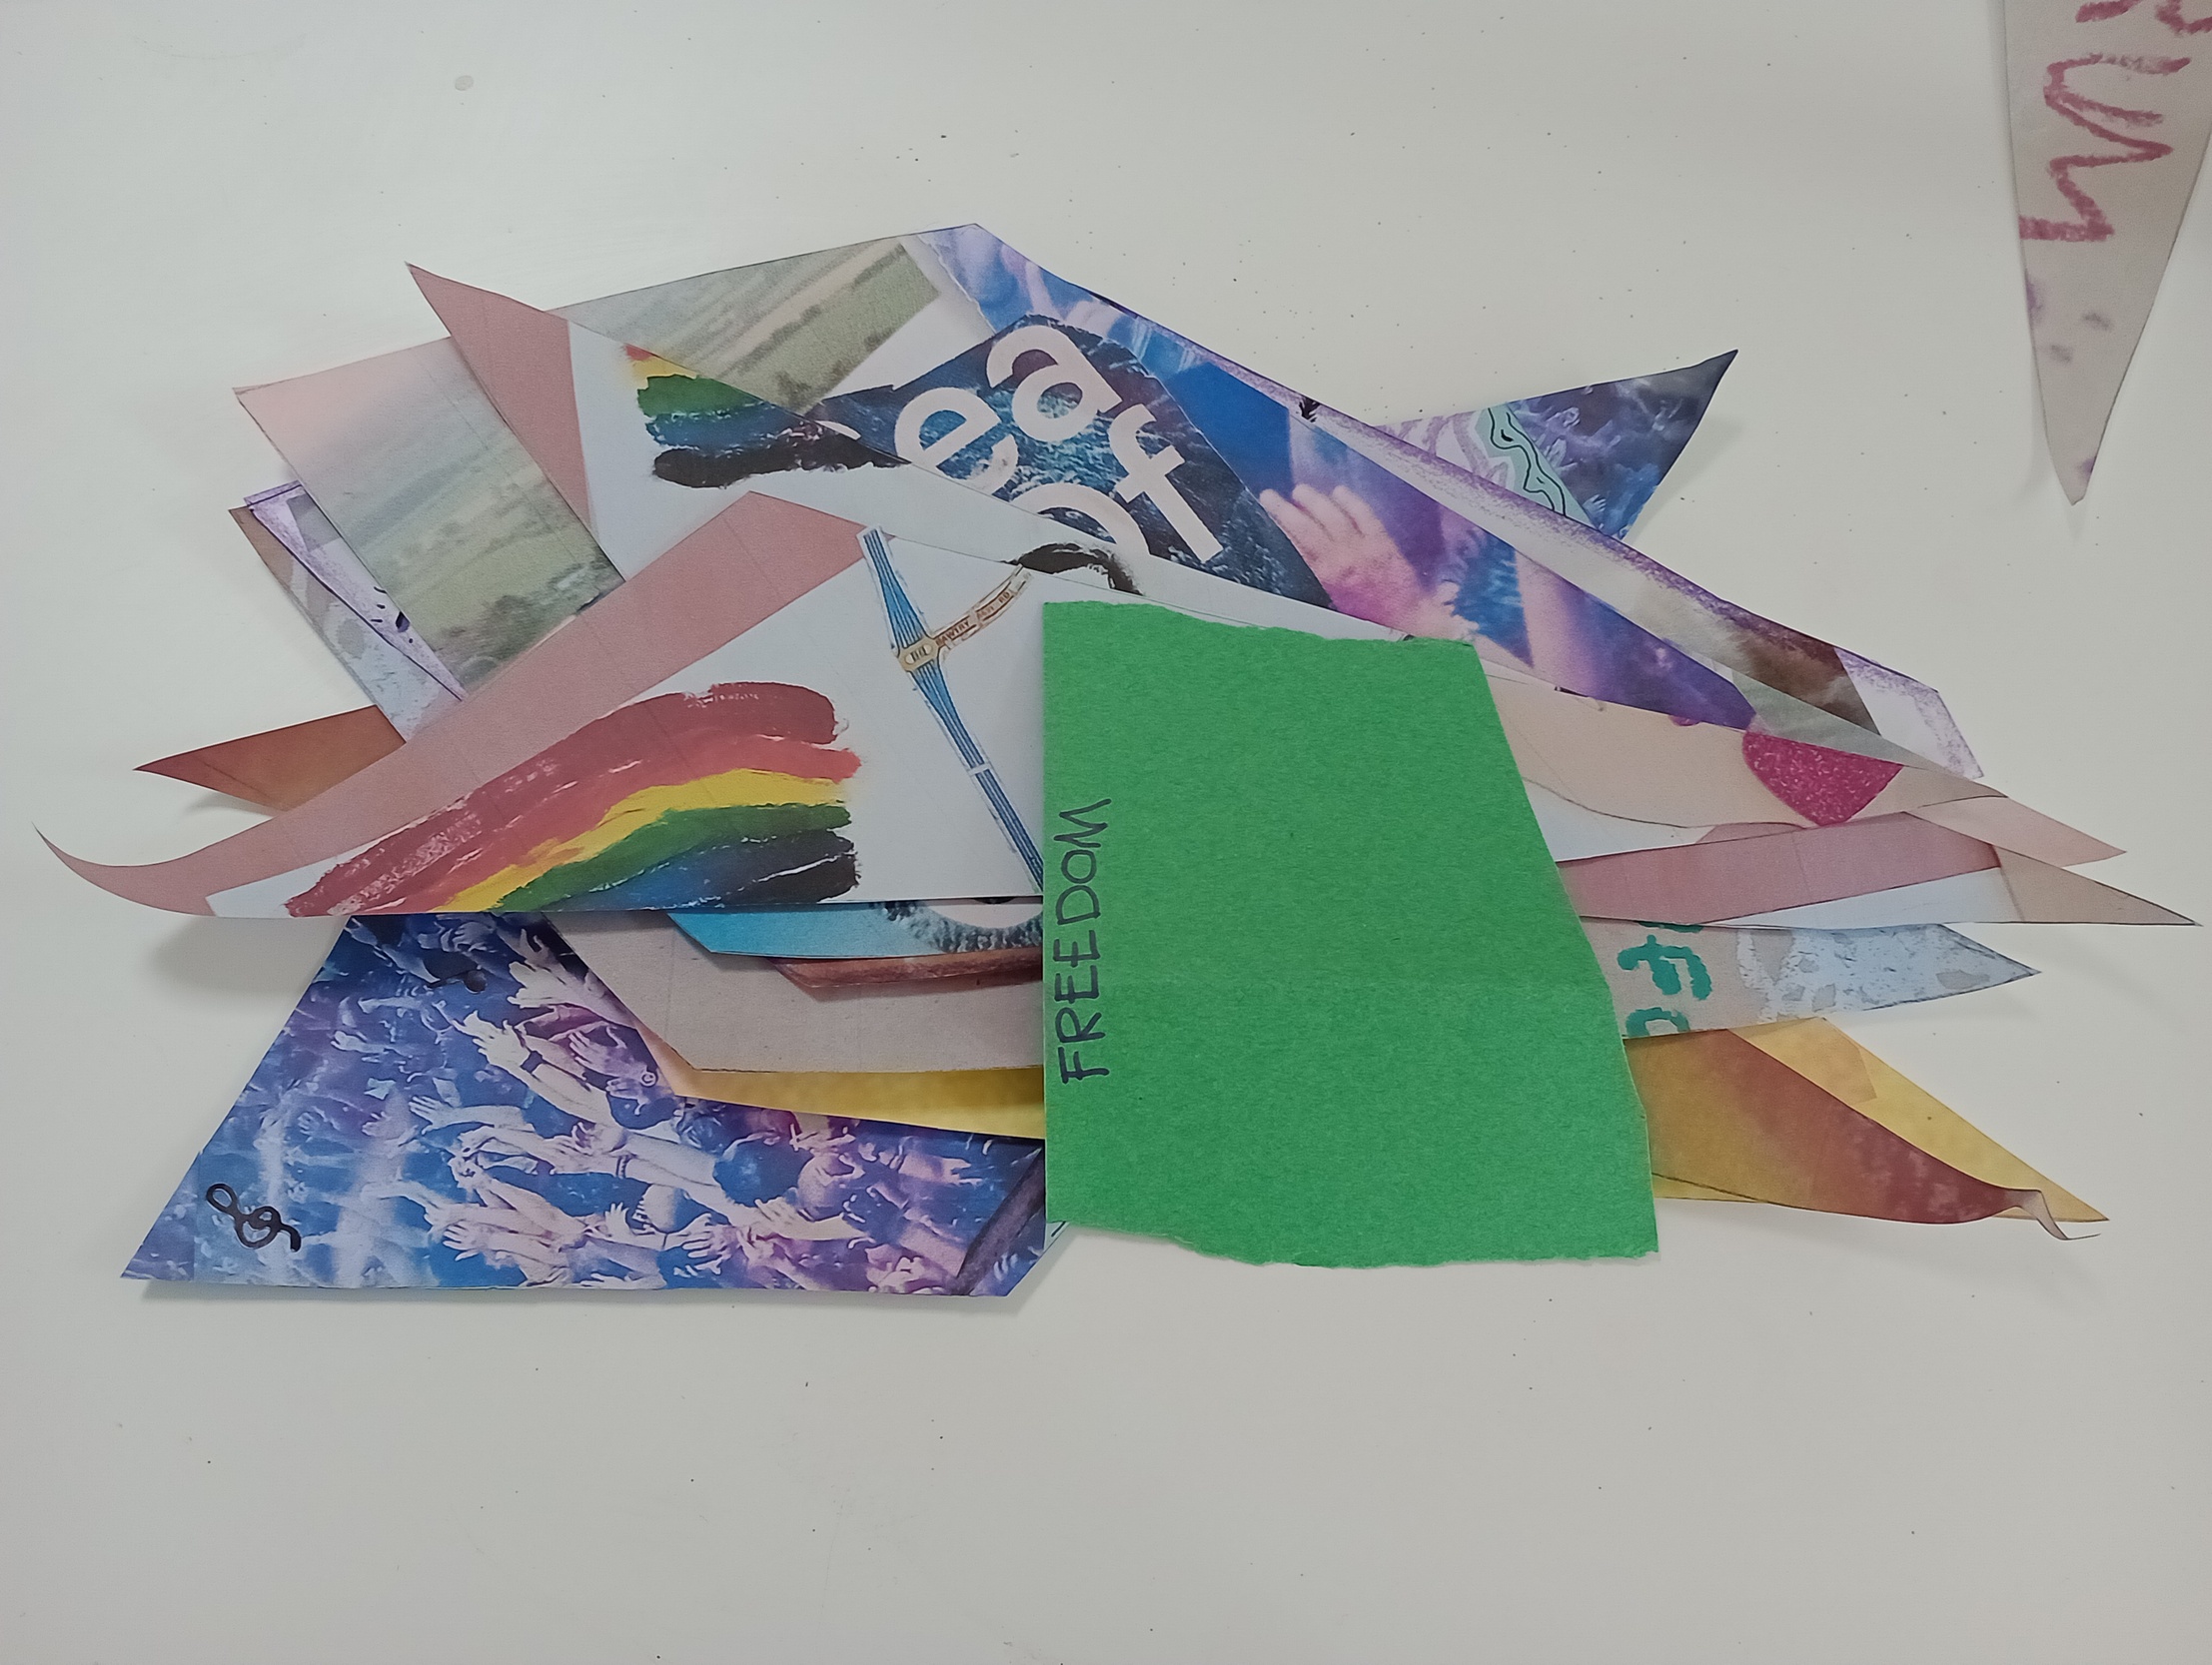
The co-researchers found that some data fit very neatly into a theme, with no debate, and some images were moved around and tried in different groups, until they found a “best fit” they were all happy with. For example, I earlier described the co-researchers “coding” John’s picture as being about security and nature. The co-researchers quickly sorted the security picture into “Goals” as a theme, as they all agreed security was a goal. However, they took some time discussing whether the connection with nature should be grouped as “Happiness” or “Freedom” and although they felt the tree and birds represented a sense of freedom, agreed they should put this in the “Happiness” pile to respect the title John himself had chosen. Occasionally, they cut kite shapes in half, putting half in each of two themes (see Image 15). They also created a pile which they did not feel fit into a theme, and at the end decided this group represented the quirkiness of the participants and called the theme “We are creative and unique” suggesting this as an important aspect of their imagined future lives.
Stage 4: Refining Themes
It is common for qualitative methods to result in multi-modal data, such as images or photos and transcripts of discussions with the participants who made the images, so that there are different but related datasets, which may benefit from an intentional process of integration (Cronin et al., 2008). This can deepen understanding, as verbal and visual data can be juxtaposed, interwoven, and each can “speak” to the other (Roberts & Collis, 2024). A benefit of collage is its potential as “a borderlands epistemology: one that values multiple distinctive understandings and that deliberately incorporates non-dominant modes of knowing” (de Rijke, 2024, p. 301). The next stage, then, involved an incorporation of words from workshop transcripts, to check, refine and enrich the themes so far proposed.
Whilst the following activity could be attempted with full transcripts, a key aim of these workshops was to include young people in the analysis process who would not be able to read large amounts of text. In order to make this manageable, in the example described here, I used the themes identified by co-researchers in the previous activities, and only printed off extracts of transcripts directly relating to those key words. I decided that doing some preparation myself would allow collaborative time to be spent discussing this (like Arcaya et al., 2018) whilst I acknowledge this editing was non-collaborative and may have removed aspects of texts the co-researchers would have liked to include.
Activity 4a: Combining visual and verbal data (Approximately an hour).
Aim: To incorporate written data, to check, refine and enrich each theme.
-
Print transcripts (or extracts) from initial sessions.
-
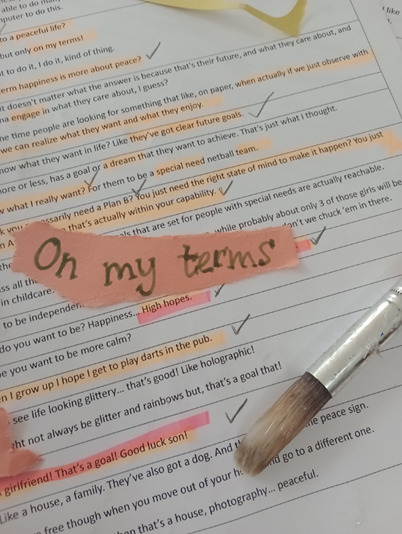
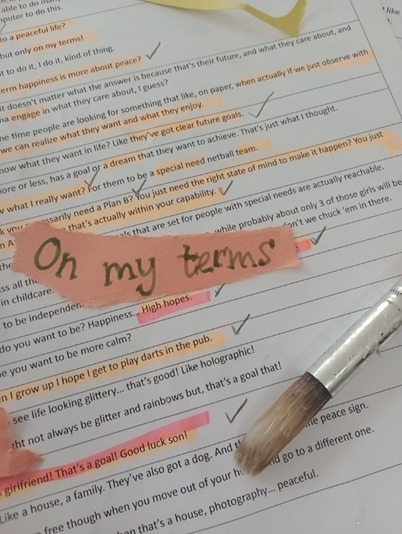
Co-researchers work in pairs to highlight quotes from the transcripts that they feel are most important for each theme (see Image 16).
-
Co-researchers cut out quotes from printed transcripts, or rewrite selected words and phrases.
-
Co-researchers can use large letters and thick pens (or print in large fonts) for words they think are particularly important, or highlight using embellishments, such as glitter, underlining or speech bubbles.
-
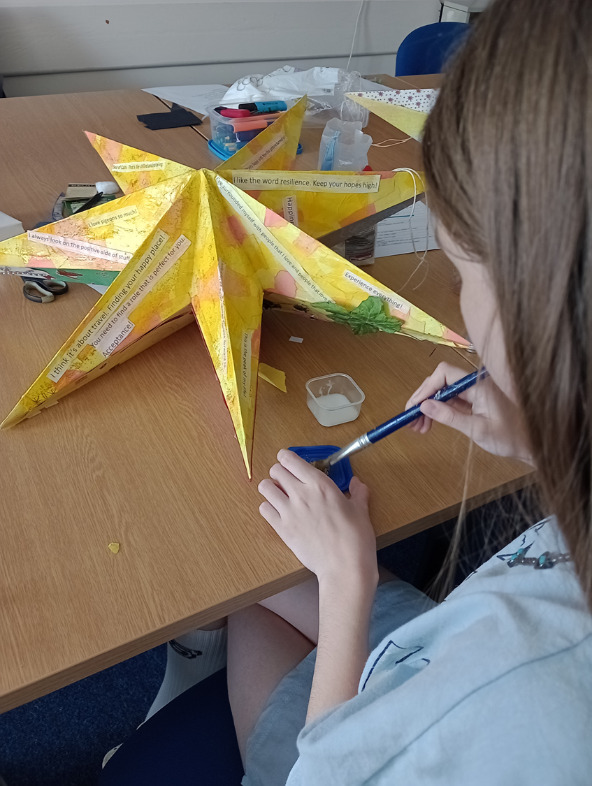
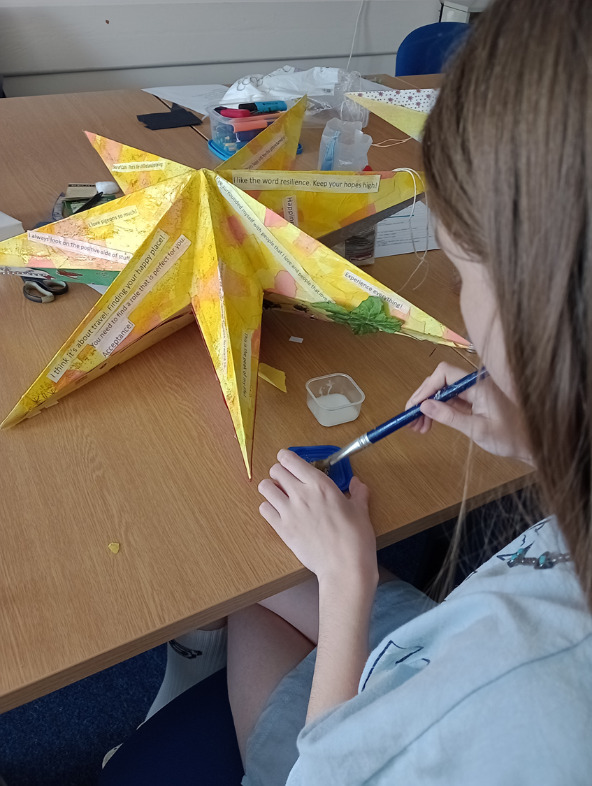
As they grow in confidence that they are happy with a theme, co-researchers begin to paste pictures and words onto lanterns, with one lantern representing each theme.
Activity 4a in practice
In this activity, initially co-researchers did not seem to enjoy looking at the transcripts to find the words they wanted to use, asked me for help, said they were not sure what to select, and were worried about getting it “wrong”. This did not happen in the visual activities. They seemed to be less confident and having less fun. The co-researchers themselves acknowledged that there were some roles that they enjoyed, and some that perhaps the researcher should take on:
Faith: I think it’s just, like, obviously I think young people should definitely be involved but I don’t think they should be involved in all aspects of the thing. Unless they really want to be.
Sally: Cause you’re guessing some of the jobs are a bit dull?
Faith: Yeah… I think it’s not that we can’t do it I just think it’s maybe a bit boring? You know like typing things up and stuff? That’d be a bit of a boring part? … I don’t think, if you said to many young people… do you think you could just, could you give up your Saturday and come with me and type up all this work? People would be like…
Primrose: [emphatically] No.
With hindsight, I could have done this aspect of the analysis myself, or found a more creative approach, like asking them to create poems from the cut-up text. However, once words were chosen, they enjoyed sticking the words and images onto the lanterns, sometimes at this stage combining two small themes together onto one lantern, and in one case, for the theme “We all have goals we want to achieve” they used two lanterns.
Stage 5: Reconstructing overall key findings together
Lincoln and Guba propose that the final stage of analysis is to reconstruct the separate pieces of data identified as important into “meaningful wholes” (Lincoln & Guba, 1985, p. 333). In this final activity, by pulling the lanterns together, co-researchers create an installation to capture the “spirit” of the individual stories in a shared piece (White et al., 2024).
Activity 5: Making a final Installation to represent key messages (Approximately one hour)
Aim: To pull data together into a cohesive representation which captures the spirit of the findings.
-
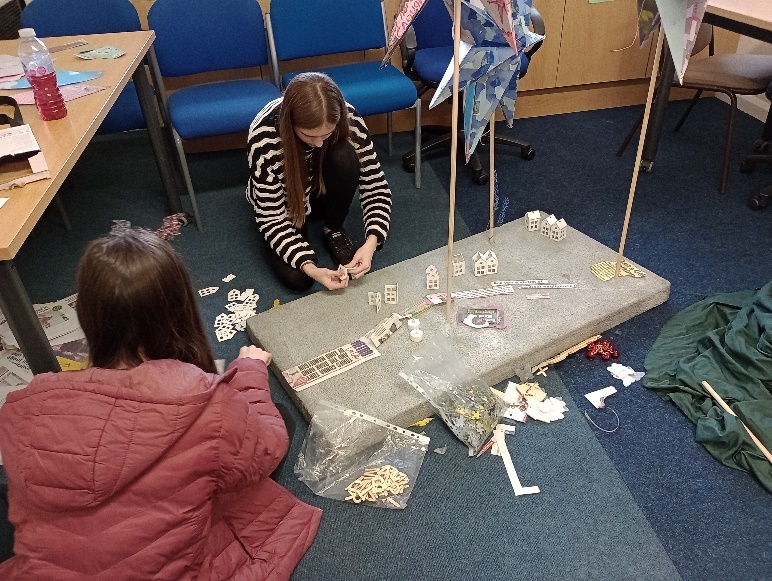
Agree with co-researchers how they would like to display the final pieces.
-
Provide a range of materials for them to use to create a display.
-
Support co-researchers to write explanatory labels and/ or record audio descriptions for a public audience about what the installation shows.
Activity 5 in practice
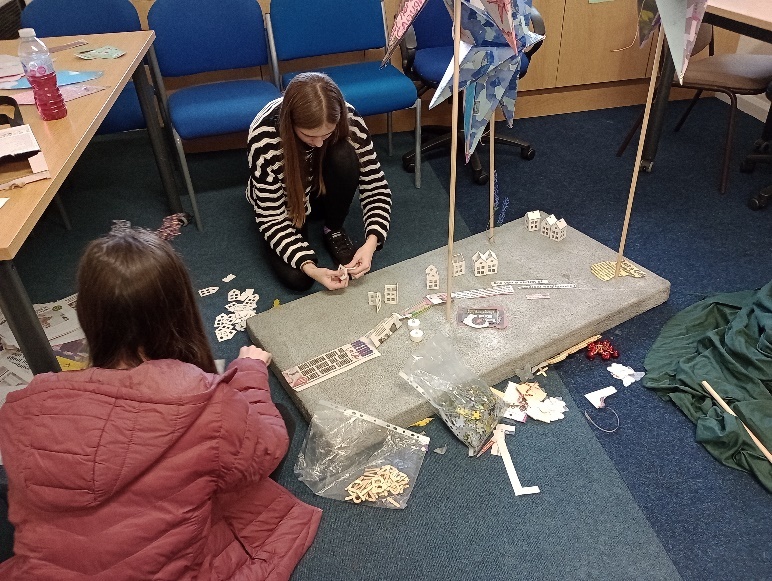
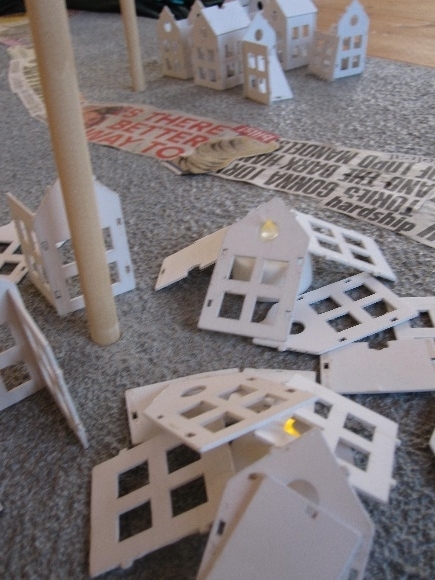
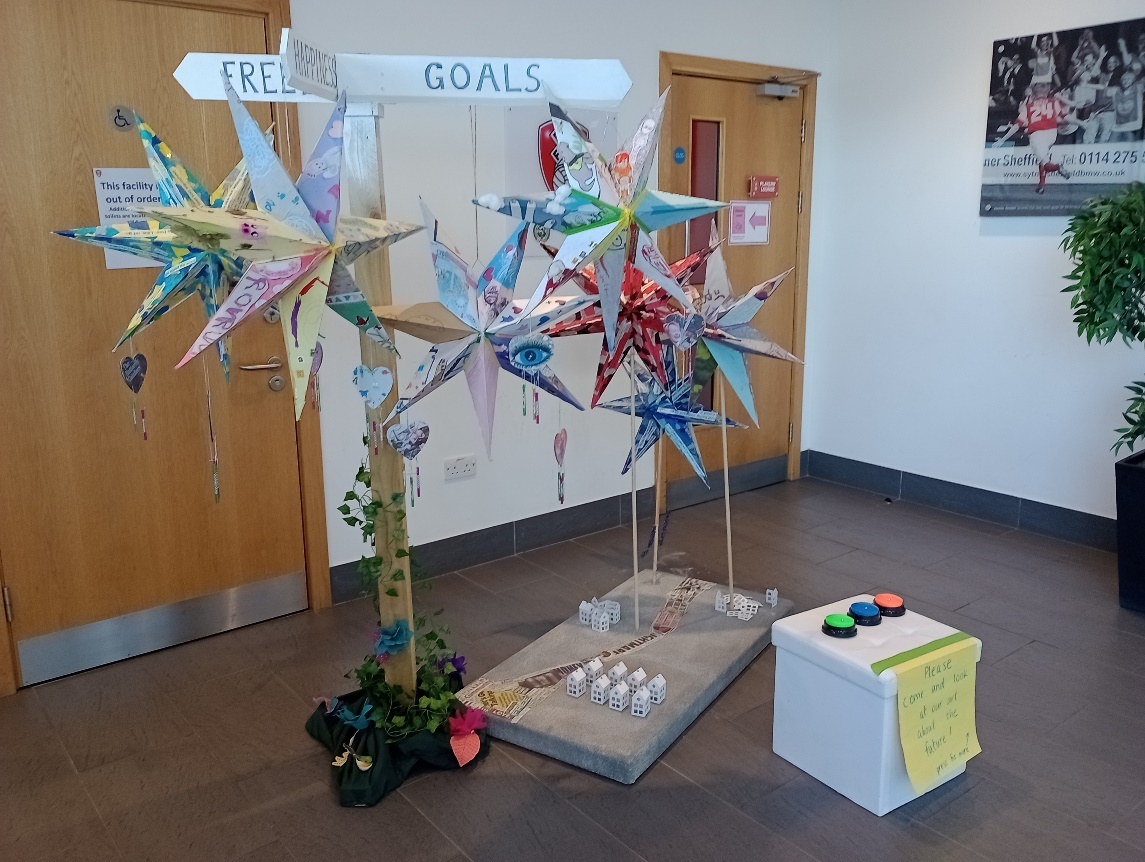
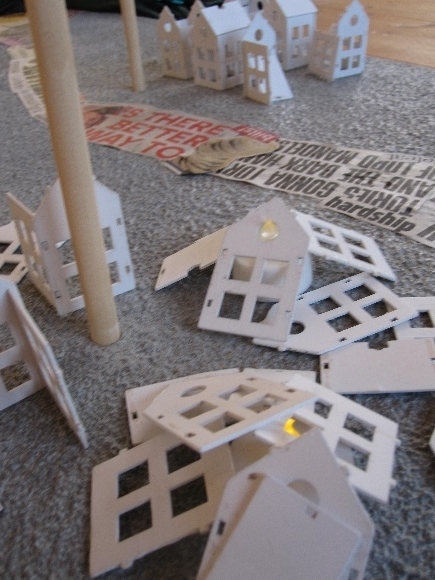
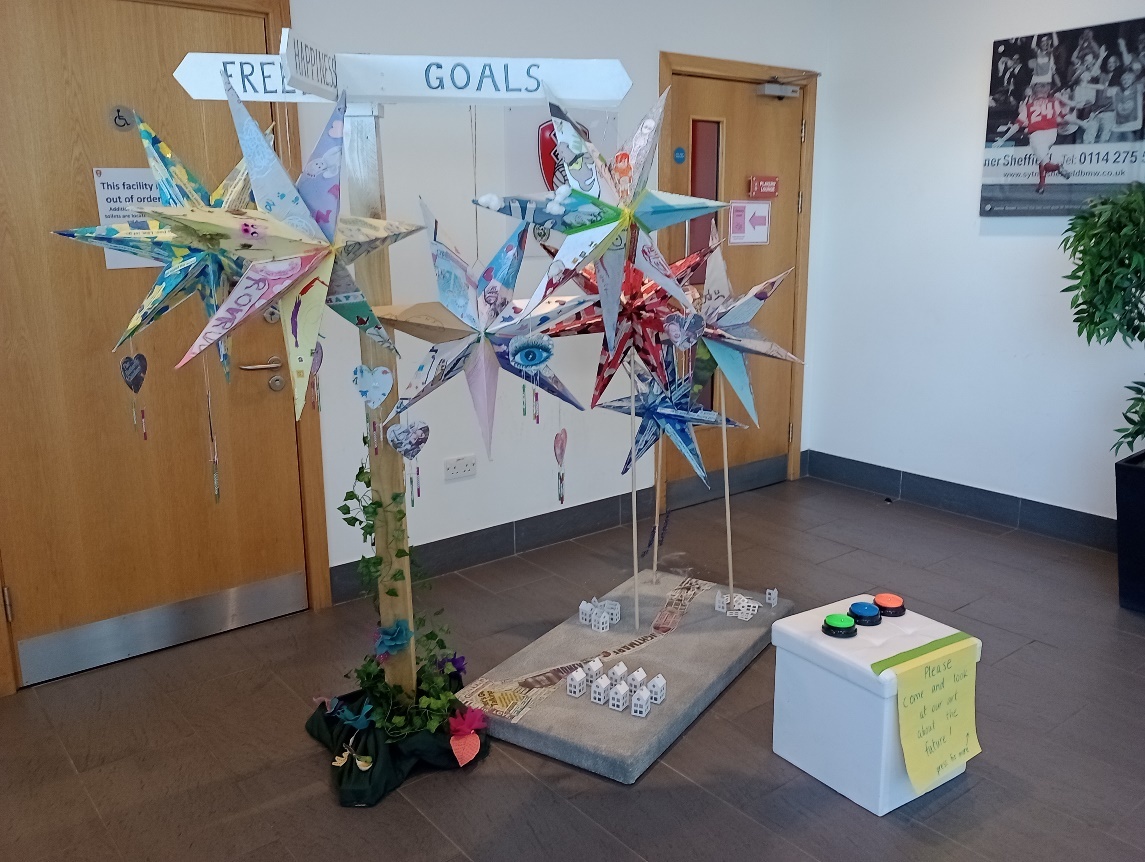
In the final workshop, co-researchers created an installation to show key aspects of the data, in words and images, organised into positive feelings about the future (happiness, freedom and goals) and negative (fears, anger and sadness). They wanted to hang the positive lanterns from real trees, and place negative ones in undergrowth, but this posed practical challenges. I proposed the signpost and the concrete base as a compromise which communicated the high/ positive and low/ negative contrast. A car boot full of other resources meant co-researchers could choose to decorate the base with rich and poor houses, to represent their concerns about inequality affecting their hopes, and flowers and leaves representing the recurring theme of nature and growth. Recording short audio descriptions for visitors to listen to motivated them to agree on a succinct summary of the research and their key findings.
Limitations
In the example presented here, the themes the co-researchers proposed, the ways they cut up and repurposed data, and the final original piece of art were not even imagined at the start of the project. This worked in the context of PhD research, with an open research question (developed with the co-researchers) and a long-standing relationship with the partner community group. Other researchers might not be able to relinquish so much control (Ryan & Bernard, 2003) and in this case, attempting to include young co-researchers risks their potential coercion into a process in which they do not genuinely have power (Gallacher & Gallagher, 2008). The co-researchers often changed or broke the rules, but knew that this was allowed. Gallacher and Gallagher propose that rather than seeing this as a limitation, “some of the most fascinating insights have emerged from children acting in unexpected ways: appropriating, resisting or manipulating our research techniques for their own purposes” (2008, p. 508). The activities are presented as ideas to encourage other researchers to explore data creatively with co-researchers and be open to being led where that takes them.
All analysis methods require the development of appropriate expertise (Ryan & Bernard, 2003). Experience as a teacher and art therapist, including over ten years working with young people with a wide range of SEND, gave me the confidence to loosely plan creative sessions, pack lots of materials “just in case” and see where the sessions went. Such approaches are not necessarily covered in conventional research training, and they may be best suited to “researchers who have strong empathic and interpersonal understanding, and who have been exposed themselves to the use of the arts” (Leitch, 2008, p. 55). An openness to embrace uncertainty and ambiguity (McNiff, 1998) is perhaps the key skill, but one that all researchers must surely cultivate.
Further, participatory research with young people involves complex ethical challenges (Clark et al., 2022). This project required an initial ethics application for recruitment and planning with co-researchers, before seeking further permissions once plans had been co-produced. Even then, ethics permission had to allow enough flexibility for the co-researchers to lead the project down new unexpected paths, which is not always possible (Hammett et al., 2022). I had worked with the community partner organisation before, so a relationship built on trust allowed me to explore, experiment and risk making mistakes (Lucero et al., 2020). Co-researchers themselves offered sensitive thoughts about issues like potential identification of individuals from their artworks, so that these were resolved collaboratively and respectfully.
Finally, whilst this collaborative approach included those being researched in analytical decision making, the conclusions drawn are one interpretation from many possible interpretations, as would be the case no matter who does the interpreting (Dey, 1993). As part of an ongoing debate about the “objectivity, validity… generalisation… and believability” of art as a data source (Eisner, 2006), I propose that the workshops created space to acknowledge these complexities and for co-researchers and myself to “stop and think, about how we might not take for granted what we see and how we might see it” (Harvey & Bradley, 2023, p. 364). Ultimately, if an aim of analysis is “representing the spirit and tone of our data” (White et al., 2024, p. 236) inclusion of co-researchers can add a layer of authenticity in a process which will always be subjective.
Conclusion
Co-researchers have often been excluded from data analysis due to the perceived need for specialist analytic training and skills, in addition to a significant time commitment and the ability to speak the language of the academy. Young people with SEND are one group who are at particular risk of being excluded from traditional forms of research, but other groups including adults lacking in confidence or literacy skills, or multilingual groups, can also benefit from alternative modalities. In this tutorial, a series of collaborative analysis activities allowed co-researchers to respond to data through creative methods, decentring language and opening up the analysis process to partners other than trained academics. In this example the young people clearly demonstrated their ability to respond sensitively to the data, as they turned it into collaged lanterns which reflected key themes and drew attention to central messages, using a mix of modalities. The co-researchers said they enjoyed these activities. I encourage any researchers interested in exploring the inclusion of co-researchers in analysis to consider collaborative collaging from data as an enjoyable and accessible approach, with the potential to keep co-researchers at the heart of the research process.