
Introduction
Globally, there is increasing recognition of the need for environmental disaster risk management to be informed by local knowledges (Hermans et al., 2022; Hewitt et al., 2012; UNISDR, 2015). Community-academic partnerships that take a community-based participatory research (CBPR) approach can facilitate the contribution of local knowledge to disaster risk management strategies (Lines et al., 2019; Peace & Myers, 2012). With an emphasis on community-derived selection of priority challenges, community collaboration in the research process, and action to effect change as a part of the research process itself (Israel et al., 1998; Minkler & Wallerstein, 2003) CBPR is well suited to collective efforts with communities to study and address environment-related challenges and inform appropriate public policies (O’Fallon & Dearry, 2002; Themba-Nixon et al., 2003). To strengthen community participation in policy development and enhance the management of disaster risk, innovative sets of tools and approaches are needed, especially in the face of advancing climate change.
Marginalized communities in the Cape Flats region of South Africa are at high risk of a range of climate-related environmental hazards (Cuff & Davidson, 2018). Due to poor quality housing, urban densification and a deficit of risk mitigating infrastructure, informal settlements and overpopulated townships are least prepared to prevent or respond effectively to environmental hazards, which are predicted to become more severe as the climate changes (Jabeen et al., 2010; Satterthwaite et al., 2018; Williams et al., 2019). Although there is a growing body of research focusing on climate resilience in informal settlements (Lakhani & Andharia, 2020; Revi et al., 2014; Usamah et al., 2014) there remains a need to deepen understanding of disaster threats and adaptive capacities at individual, household and community levels in the most at-risk settings. The City of Cape Town (CoCT) has developed a strategic framework to enhance resilience and mitigate the impacts of climate change in the city (The City of Cape Town, 2019). This framework emphasizes the intention of the CoCT to support participatory approaches and integrate public participation in the development of policies to build collective resilience amongst the city’s residents.
In this study, we facilitated CBPR with community members in three marginalized areas of Cape Town at high risk of flooding, fire outbreaks and water scarcity. As an innovative approach to CBPR, we designed and implemented a layered participatory visual methods process. Participatory visual methods include an array of techniques from drawing and painting activities (e.g. mapping exercises) to those that involve working with advanced forms of technology to produce electronic outputs (e.g. photovoice, digital storytelling and participatory video) (Black & Chambers, 2019; Lambert, 2013; Mitchell et al., 2017; Shaw & Robertson, 1997; Wang & Burris, 1997). Because they transcend barriers of language and literacy (Theron et al., 2011), visual methods offer an opportunity for people who might normally be excluded or under-represented to input into resilience action prioritisation. While there is evidence that participatory visual methods can be effective in supporting community members to consider locally appropriate resilience actions and inform government strategies on disaster risk management, there is not, to date, an effective model for working in stages with multiple visual methods across a program of research to strengthen community capacity in identifying problems, formulating solutions and engaging for government responsiveness.
Building on a preliminary household survey, we iteratively applied digital storytelling, community mapping and photovoice to gain an increasingly deeper and wider understanding of the challenges incurred by these environmental disasters. The research approach was replicated in the three communities to allow for comparison and contrast between the three settings. The visual data generated through each method were examined in distinct stages of participatory analysis undertaken by community-based co-researchers (CBCRs) and facilitated by members of our team. Analytical findings were triangulated to co-develop a set of overarching ‘Best Bets’ that were further unpacked into more detailed potential intervention strategies. This was followed by workshops aimed at building the capacity of the participating community members in stakeholder and policy engagement. Thereafter these community members led engagement activities wherein they presented their visual materials, analytical findings and strategies for disaster risk management at events attended by CoCT officials from multiple departments, relevant NGOs and members of the public. In this article we provide details of the methodological approach we took to knowledge generation and engagement. We share our learnings from facilitating the visual methods approach, the possibilities it presented and the challenges and limitations we encountered. In this paper we propose a model that expands on current community engagement and CBPR methodologies and addresses gaps in community engagement literature. In doing so we offer a resource for use by CBPR and action researchers to mitigate climate impacts and address other global development challenges through the systematic identification of pragmatic interventions by those who are most at-risk.
Literature Review
Over the past 30 years CBPR has become established as a valued research approach, especially within health and social science disciplines, for its potential to address crucial gaps in local knowledge and reduce inequities (Israel et al., 2013; Wallerstein et al., 2017). CBPR seeks to integrate community partners throughout a research process whilst aiming to prevent ethical challenges such as stereotyping and stigmatizing that have been historically harmful (Tuck & Yang, 2012). CBPR has drawn from the Global South tradition of activist participatory research from the 1970s and from Paulo Freire’s praxis-based empowerment education, recognizing “expertise in the world of practice, beyond academia”(Freire, 1970; Tandon et al., 2016; Wallerstein & Duran, 2018).
CBPR as a form of action research to inform development practice and policy can be challenged by barriers that obstruct inclusive engagement and prevent the meaningful involvement of communities in dialogue with key stakeholders. For example, a significant challenge that confronts local government responsiveness to the climate crises in the CoCT is the ordinarily poor relationship between informal settlements and the city. As noted by Chatterjee (Chatergee, 2004) democratic states of the south generally tend to have ambivalent attitudes towards residents of informal settlements due to their illegal standing, whilst these residents still hold the right to vote. Ambivalence towards informal settlements and the urban poor in general is evident in many municipalities in South Africa, including Cape Town (Anciano & Piper, 2019). Studies undertaken in different African countries have found that meaningful CBPR with affected communities can also be constrained by ‘tokenistic involvement’ and no ‘culture of engagement’ (Masefield et al., 2021). People who live in marginalized places are usually deprived of opportunities for public speaking or participating in policy debate, which can make the articulation of arguments and the concept of community engagement and policy engagement intimidating prospects. Linked to this are underlying power dynamics that make it hard for disadvantaged people to participate fully in ‘invited spaces’ (Gaventa, 2006; Juta & Mello, 2023; Mitchell et al., 2017). In the face of such substantive challenges, consideration must be given to identifying participatory research methods that can meaningfully bolster community representation in engagement spaces and move knowledge frameworks building away from extractive research practice towards forms of co-production (Klenk et al., 2017).
There are numerous arguments for taking a visual methods approach in CBPR, wherein community participants create evidence and data, individually or collectively, that illustrates their experiences, insights and ideas through their own eyes and in their own words with minimal intervention. The creative arts such as drama, puppetry, music, and storytelling build upon emotions, gestures, and the senses to express the multifaceted nature of challenging human experiences (Adelle et al., 2022; Carey, 2006). Tremblay (Tremblay, 2013) and others (Mitchell, 2015; Shaw, 2017) have discussed the theoretical and methodological ability of participatory video, for example, to mitigate power imbalances and enhance dialogue and learning between researchers, policymakers, and community members. Arts-based methods can therefore play an important role in helping to convert concepts and ideas into tangible symbolic materials in which knowledge can be contained and transmitted, including knowledge based on lived experience gained through the act of surviving in the world, which is often excluded from governance decisions (Adelle et al., 2022; Tandon et al., 2016). Shaw (Shaw, 2017) discussed the ability of creative processes to promote the mobilisation of knowledge by acting as communication intensifiers that help to bridge the gap between knowledge and knowing. As reported elsewhere, (Black & Sykes, 2022; Umurungi et al., 2008) visual forms of producing and communicating data can help to circumvent challenges of literacy and transcend language barriers. Through participation in visual methods processes, affected community members can distil their knowledge, collectively formulate local solutions and use their visual materials to present these solutions to similarly affected communities, government officials and other stakeholders (Mitchell et al., 2017). There are multiple ethical considerations of working with visual methods and these have been widely discussed in the literature (Black & Chambers, 2019; Gubrium et al., 2014; Prosser, 2000; Rose, 2016; Wiles et al., 2011).
In the ‘Water and Fire’ project we took a participatory visual methods approach that included digital storytelling, community mapping and photovoice, to differentially demonstrate how environmental hazards are experienced at household, neighbourhood, and community levels from the perspective of our co-research partners. A digital story is a short film made up of static images, usually created by an individual in a collective workshop (Lambert, 2013). Community mapping supports people in a community to jointly gain understanding about their local context using the mapping process. It offers a way to look at the relationship between important places and spaces in a community (Asian Coalition for Housing Rights, 2011). Photovoice enables people to represent the places where they live and their everyday situations by taking photographs (Wang & Burris, 1997). In low- and middle-income countries digital storytelling has been applied to imagine future drought scenarios and increase awareness of local issues for policy makers (Van Loon et al., 2020), photovoice has been used to explore the anticipated impacts of climate extremes including flooding (Adams & Nyantakyi-Frimpong, 2021), and community mapping has been used to better understand and respond to fire risk (Rahmawati et al., 2016).
Whereas the strength of these methods has been well demonstrated when they are used in isolation, there is a lack of evidence for how they can best be combined in a research process as a means to ultimately strengthen engagement in public participation for policy development. There are also gaps in understanding and practice regarding how to meaningfully involve community-based creators of visual evidence in analysing their data, turning the findings into plans for action and presenting these calls for action in policy spaces. This paper presents a methodological approach that addresses the gaps stated above. It responds to calls for research processes to identify practice that can increase the likelihood of effective community engagement within projects initiated by academic partners (Hall et al., 2015). In contrast to the argument that forms of participation are not as important as the way they are facilitated or the management of group dynamics (Chess & Purcell, 1999) we take the perspective that the outcome of engaged research is strongly dependent on the methods used.
Study overview
The research described in this article was undertaken as part of a three-year study (2019-2022), ‘Water and Fire: Enhancing capacity and reducing risk through 15 ‘Best Bets’ for transformative adaptation with vulnerable residents on the Cape Flats’, hereafter referred to as the ‘Water and Fire’ project. In undertaking this work we were responding to three central objectives of the ‘Water and Fire’ project. Firstly, to address three environmental hazards affecting three marginalized communities with the aim of enhancing local capacity to reduce disaster risk. Secondly to co-create alternative development pathways for sustainability by mobilising local knowledge and literacy through democratic participation and dialogue. Thirdly to engage community-derived, co-produced and creative processes to share information and build strategic resilience action on disaster risk reduction with risk-affected communities.
Methods
‘Water and Fire’ research activities were approved by the University of Stirling General University Ethics Panel and the University of Cape Town Institutional Review Board. The CoCT Research Office also granted permission for the study.
The field research process was led by a local research NGO, The Sustainable Livelihoods Foundation (SLF) with a team typically comprising up to six persons, made up of senior researchers (three individuals) and junior researchers (three individuals). All senior researchers were PhD qualified, supported by Masters and Honours level team members. The research team was diverse in culture, linguistic skills, racial profile, and gender. The senior researchers in the SLF team had engaged with key officials in the CoCT through previous research on several development issues including environmental conservation. The ‘Water and Fire’ project was the first opportunity for the SLF team to support policy engagement on matters of climate-related risk and adaptation.
The research was conducted in two informal settlements, Overcome Heights and Sweet Home Farm, and one large township, Delft, all within the municipality of the CoCT. In choosing the research sites, we sought to obtain a geographic distribution reflective of both the Cape Flats and the environmental hazards that most severely affect South Africa’s diverse urban settlements. For the climate challenges of fires and localised flooding we intentionally chose informal settlements where these challenges are pronounced. For the challenge of water scarcity, a township of predominately formal housing was selected. The ‘Water and Fire’ project began soon after Cape Town’s ‘Day Zero’ crisis in 2018 (Winter, 2018) thus severe water scarcity was a recent and intensified climate challenge, especially for the poorest areas of the city. In addition, the three sites were selected based on known socio-economic data. Each research site reflected differing settlement characteristics and infrastructural amenities, and all had been prior research sites for SLF over the previous decade in various socio-economic and health-related studies. We have published details about the three research sites elsewhere (Mpofu-Mketwa et al., 2023; Ncube et al., 2023; Wilson et al., 2023, 2025).
Covid-19
‘Water and Fire’ research activities were implemented across various levels of lockdown imposed by the South African national government in response to the Covid-19 pandemic. Research approaches were adjusted in accordance with social distancing restrictions and related legal and public safety dynamics. All necessary adjustments to the research were approved by the overseeing ethics committees.
Language
Whilst English was the language most used throughout the research process, many interviews, workshop activities and consent procedures were conducted in isiXhosa or Afrikaans (Mpofu Mketwa and Abrams, under review). Throughout the research process, mother-tongue speakers of each of these languages were actively involved in translation support. Where necessary, research outputs were transcribed into English, allowing the facilitation team to support the analysis undertaken by the co-researchers. An independent reviewer was engaged to compare baselines and confirm that transcriptions made were accurate representations of respondent discussion.
Consent
Comprehensive information sheets and consent forms were shared and discussed with participants before the commencement of each research method. All were made aware of the obligations of the research and their rights as participants. This included their ownership of the visual materials they created, their right to anonymity and the option to withdraw from the research process at any point. The information sheets and consent documents were approved by the overseeing ethics committees.
Data management
All outputs were organized, filed, and electronically stored for use in both the community meetings phase of the research, and for subsequent policy engagement sessions with local authorities where policy recommendations were likely to be most impactful.
Project inception meetings
In the first quarter of 2020, preliminary meetings were held with a general audience of approximately 50 residents in each site to introduce the ‘Water and Fire’ project and share the research aims and objectives. These meetings were held in community halls over 3-4 hours duration, before the Covid-19 lockdown restrictions were declared. The meetings provided an opportunity for initial engagement between the research team and community members on the topics of localized flooding, fire, and water scarcity. They also enabled the identification of community advisory board (CAB) members, and potential participants for a household survey, which was conducted prior to initiating the participatory visual methods activities. The role of the CAB members was to support the mobilization of CBCRs in their respective communities, provide translation in subsequent workshops and meetings, and provide general guidance to the research team in relation to field work activities and interactions with community participants. CAB members and CBCRs were recruited based on their interest in the project and their availability to take part.
Household survey
The household survey was conducted telephonically with six hundred adult participants (200 per site) representing individual households in the three research sites (Ncube et al., 2023). All households within the three research communities were eligible for participation. The survey was conducted as a baseline overview to generate statistically significant data on household demographics, living conditions and individual perceptions of the environmental hazards under study. By identifying important issues and prominent themes, the survey also helped to inform focal points for the subsequent in-depth visual methods enquiry. The household surveys also enabled purposive enrolment of CBCRs in the visual methods phase of work (Mpofu-Mketwa et al., 2023).
CBCRs
The core group of CBCRs comprised of 8 participants from Overcome Heights, 9 participants from Sweet Home Farm, and 8 participants from Delft. For community mapping and photovoice processes, the community-based researchers were issued with an identification badge showing their name, photograph, and organisational identity, and an SLF branded hat and clothing. Transport and catering were provided to all CAB members and co-researchers, as was a stipend to cover costs of childcare, communications or other expenses incurred as a consequence of their participation.
Participatory visual methods
The visual methods applied in the ‘Water and Fire’ project have been used previously as instruments for environmental/environmental disaster/climate change research (Adams & Nyantakyi-Frimpong, 2021; Rahmawati et al., 2016; Van Loon et al., 2020).
In overview, the participatory visual methods approach incorporated a continuous and iterative process of digital storytelling, community mapping and photovoice. This allowed for a more in-depth, creative enquiry on personal lived experiences of fire, flooding and water scarcity to differentially demonstrate how these environmental disasters are experienced at household, neighbourhood, and community levels from the perspective of our co-research partners. In all three sites, each methodological process was conducted in the same order, following the same methodological approach. This meant the research could build on each additional layer of investigation, thus compounding learnings and data for each subsequent research process. We were able to amend responsively the pathway of enquiry for each site, taking into account new learning and building on prior experience and newfound knowledge.
Digital storytelling
A digital story is a short film made up of static images, usually created by an individual in a collective workshop (Lambert, 2013). Participants in the household surveys who had indicated an interest and availability to be further involved in the study were enrolled into the digital storytelling (DST), in liaison with CAB advisors. The DST method followed a Story-Led approach (Black & Chambers, 2019) and comprised four main elements: i) an inception and participation consent meeting ii) a 5-day creative workshop iii) video editing iv) a story sharing consent workshop. The ‘Water and Fire’ project DST methodology is described in detail elsewhere (Mpofu-Mketwa et al., 2023). The open-ended questions that underpinned the storytelling process in each of the respective communities is shown in Table 1. The DST process and some of the subsequent community mapping and photovoice workshops, were undertaken in studios at the SLF premises with access to electricity, computers, and reliable internet.
Community mapping
Community mapping is a participatory method that supports people in a community to jointly gain understanding about their local context using the mapping process. It offers a way to look at the relationship between important places and spaces in a community (Asian Coalition for Housing Rights, 2011). Community mapping activities commenced from the third quarter of 2021 as Covid-19 restrictions eased. In each community setting, we worked with 4 co-researchers per day, over 4 days (i.e. 16 co-researchers per site) making a total of 48 participants from the three communities. In general, half of the community mapping participants had taken part in the digital storytelling. Each of them invited another member of their community, from a separate household, to join the mapping process as a buddy. As for the DST, an inception workshop was held at the SLF premises to discuss the aims, objectives and steps involved in the ‘Water and Fire’ community mapping methodology. In each case, a local community hall or public meeting place suited to the research activity was identified and established as a logistical base for workshopping purposes.
Following the inception workshop, in previously agreed groups of four people, the co-researchers and SLF research team set out into the field on foot, with a loose agenda for engagement that was centred around each person’s experience of the relevant local disaster. The opening activity was an immersive mapping process that involved the groups walking between local sites of interest to map the local impacts of the environmental hazard under investigation. So as not to exert undue influence over discussions, this activity was entirely led by the CBCRs who took the SLF researchers to a particular geographic site that was relevant to the specific local climate-related hazard (referred to as the ‘special place’ – see Appendices 1, 2 and 3). These sites had been chosen in advance by the co-researchers and could be anywhere of significance for the participant. On arrival at these sites, open-ended discussions were held for all in attendance to learn more about why the participant considered this place to be important in relation to the relevant climate-related hazard. Voice recording devices, GPS devices, cameras and video recorders were used to document the process. Voice recordings were transcribed and, where necessary, translated into English.
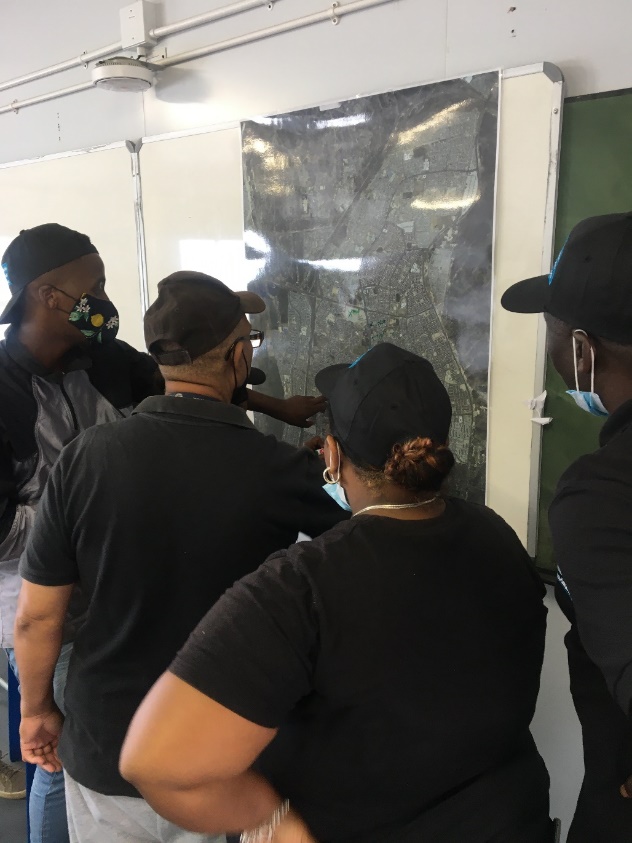
Following the field-based activity the co-researchers and SLF research team went to the local meeting place to further discuss the findings of the day in a facilitated workshop process. In these workshops, each co-researcher drew annotated maps (on flip chart paper) to illustrate their perspective of the relationship between their local environment and fire outbreaks, flooding, or water scarcity. To guide this process, the SLF team asked a range of open-ended questions. Again, the discussions were recorded and documented. Finally, in a whole group exercise, the CBCRs collectively reviewed and marked up a high-resolution A1-size aerial photo of the wider site according to the climate challenge topic. For example, in Overcome Heights the CBCRs annotated the aerial photo with details of local fire events, sharing their knowledge of where and when fires had happened and how large they had been, and where possible other data such as the cause of the fire.
Photovoice
Photovoice is a participatory visual method that enables people to represent the places where they live and their everyday situations by taking photographs (Adams & Nyantakyi-Frimpong, 2021; Wang & Burris, 1997). Within a few days of the community mapping process, the same core group of CBCRs (primarily those who had taken part in the DST) transitioned into a photovoice activity. As with the DST and community mapping, photovoice was initiated with a preparatory workshop wherein the co-researchers received training from a professional photographer with experience in participatory research. As the photographs were to be taken using hand-held digital cameras (carrying SD cards), training included technical camera skills, and advice on lighting, framing and angles. It also included a session on the ethics of photography. During this workshop, the research questions, which had been developed by the SLF research team, were presented, and discussed with the co-research groups. The research questions underpinning the Photovoice process are shown in Table 2.
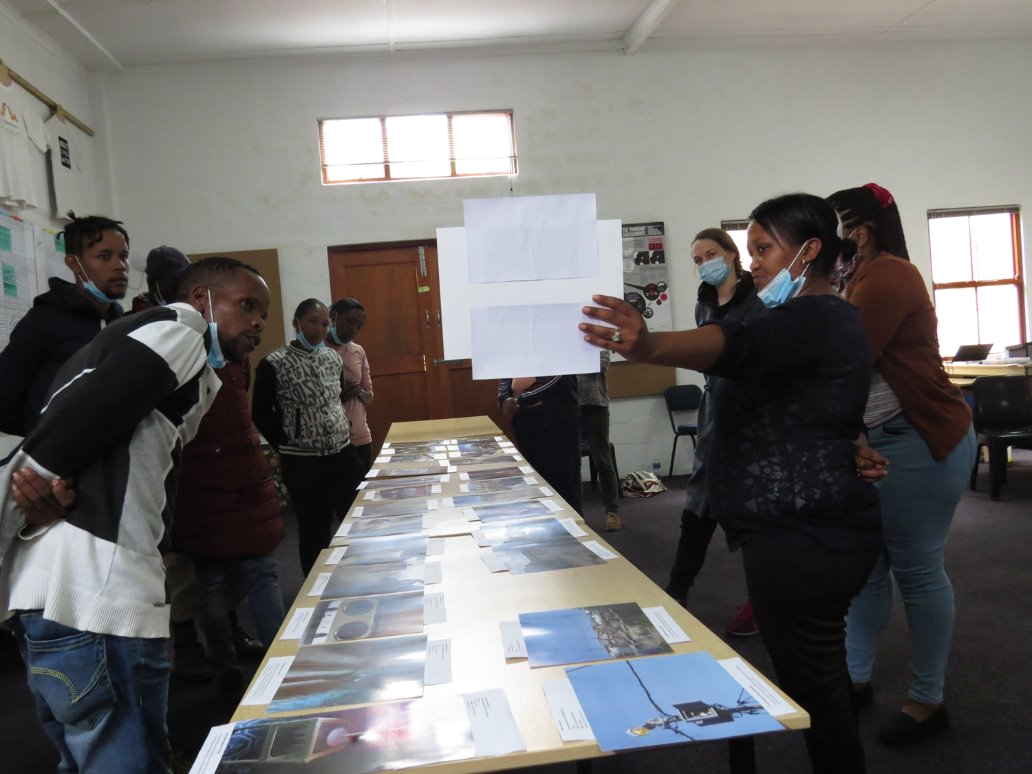
The co-researchers were requested to take at least 10 photos in response to each of the three overarching research questions i.e. each co-researcher was tasked with taking a minimum of 30 photographs. After the training session, the co-researchers worked independently in the field for seven days, during which time they took their photographs and - in response to the research questions - wrote individual descriptions encapsulating the story behind each of the 30 images. In addition to digital cameras, the co-researchers were provided with field folders containing a compendium of documents including technical advice, pages to record narratives for each photograph, and ethics guidelines. A WhatsApp group, managed by the research team was used throughout the process to share progress and address any queries or challenges experienced by the CBCRs. At the end of their independent field work, members of the SLF research team met with the co-researchers at a mutually agreed site and time in the community settings to collect the cameras. Every photograph taken was printed. At a subsequent workshop held at SLF, the co-researchers worked in pairs with SLF facilitators to review (on a computer screen) digital copies of their images and refine the associated written descriptions (Wilson et al., 2023). As part of this session, the photographers were requested to shortlist 12 of their own captioned images (four per research question) that they personally felt best reflected the environmental hazard under investigation. Printed copies of individual ‘top 12’ images that were self-selected by the co-researchers were exhibited to the CBCR group in a gallery format, categorized by research question, along with their corresponding narratives. From this general pool of, on average, 96 photographs, all members of the group were requested to choose a total of up to 12 images that had been captured by their colleagues (not including their own) that they felt best reflected the environmental hazard under investigation. This collective process allowed the CBCRs to review a large selection of the photovoice images taken in their community and vote for those of their choice. The images and captions that were most voted for through this democratic process (Table 3) then formed the basis of the collective final photovoice product for each site.
Participatory analysis
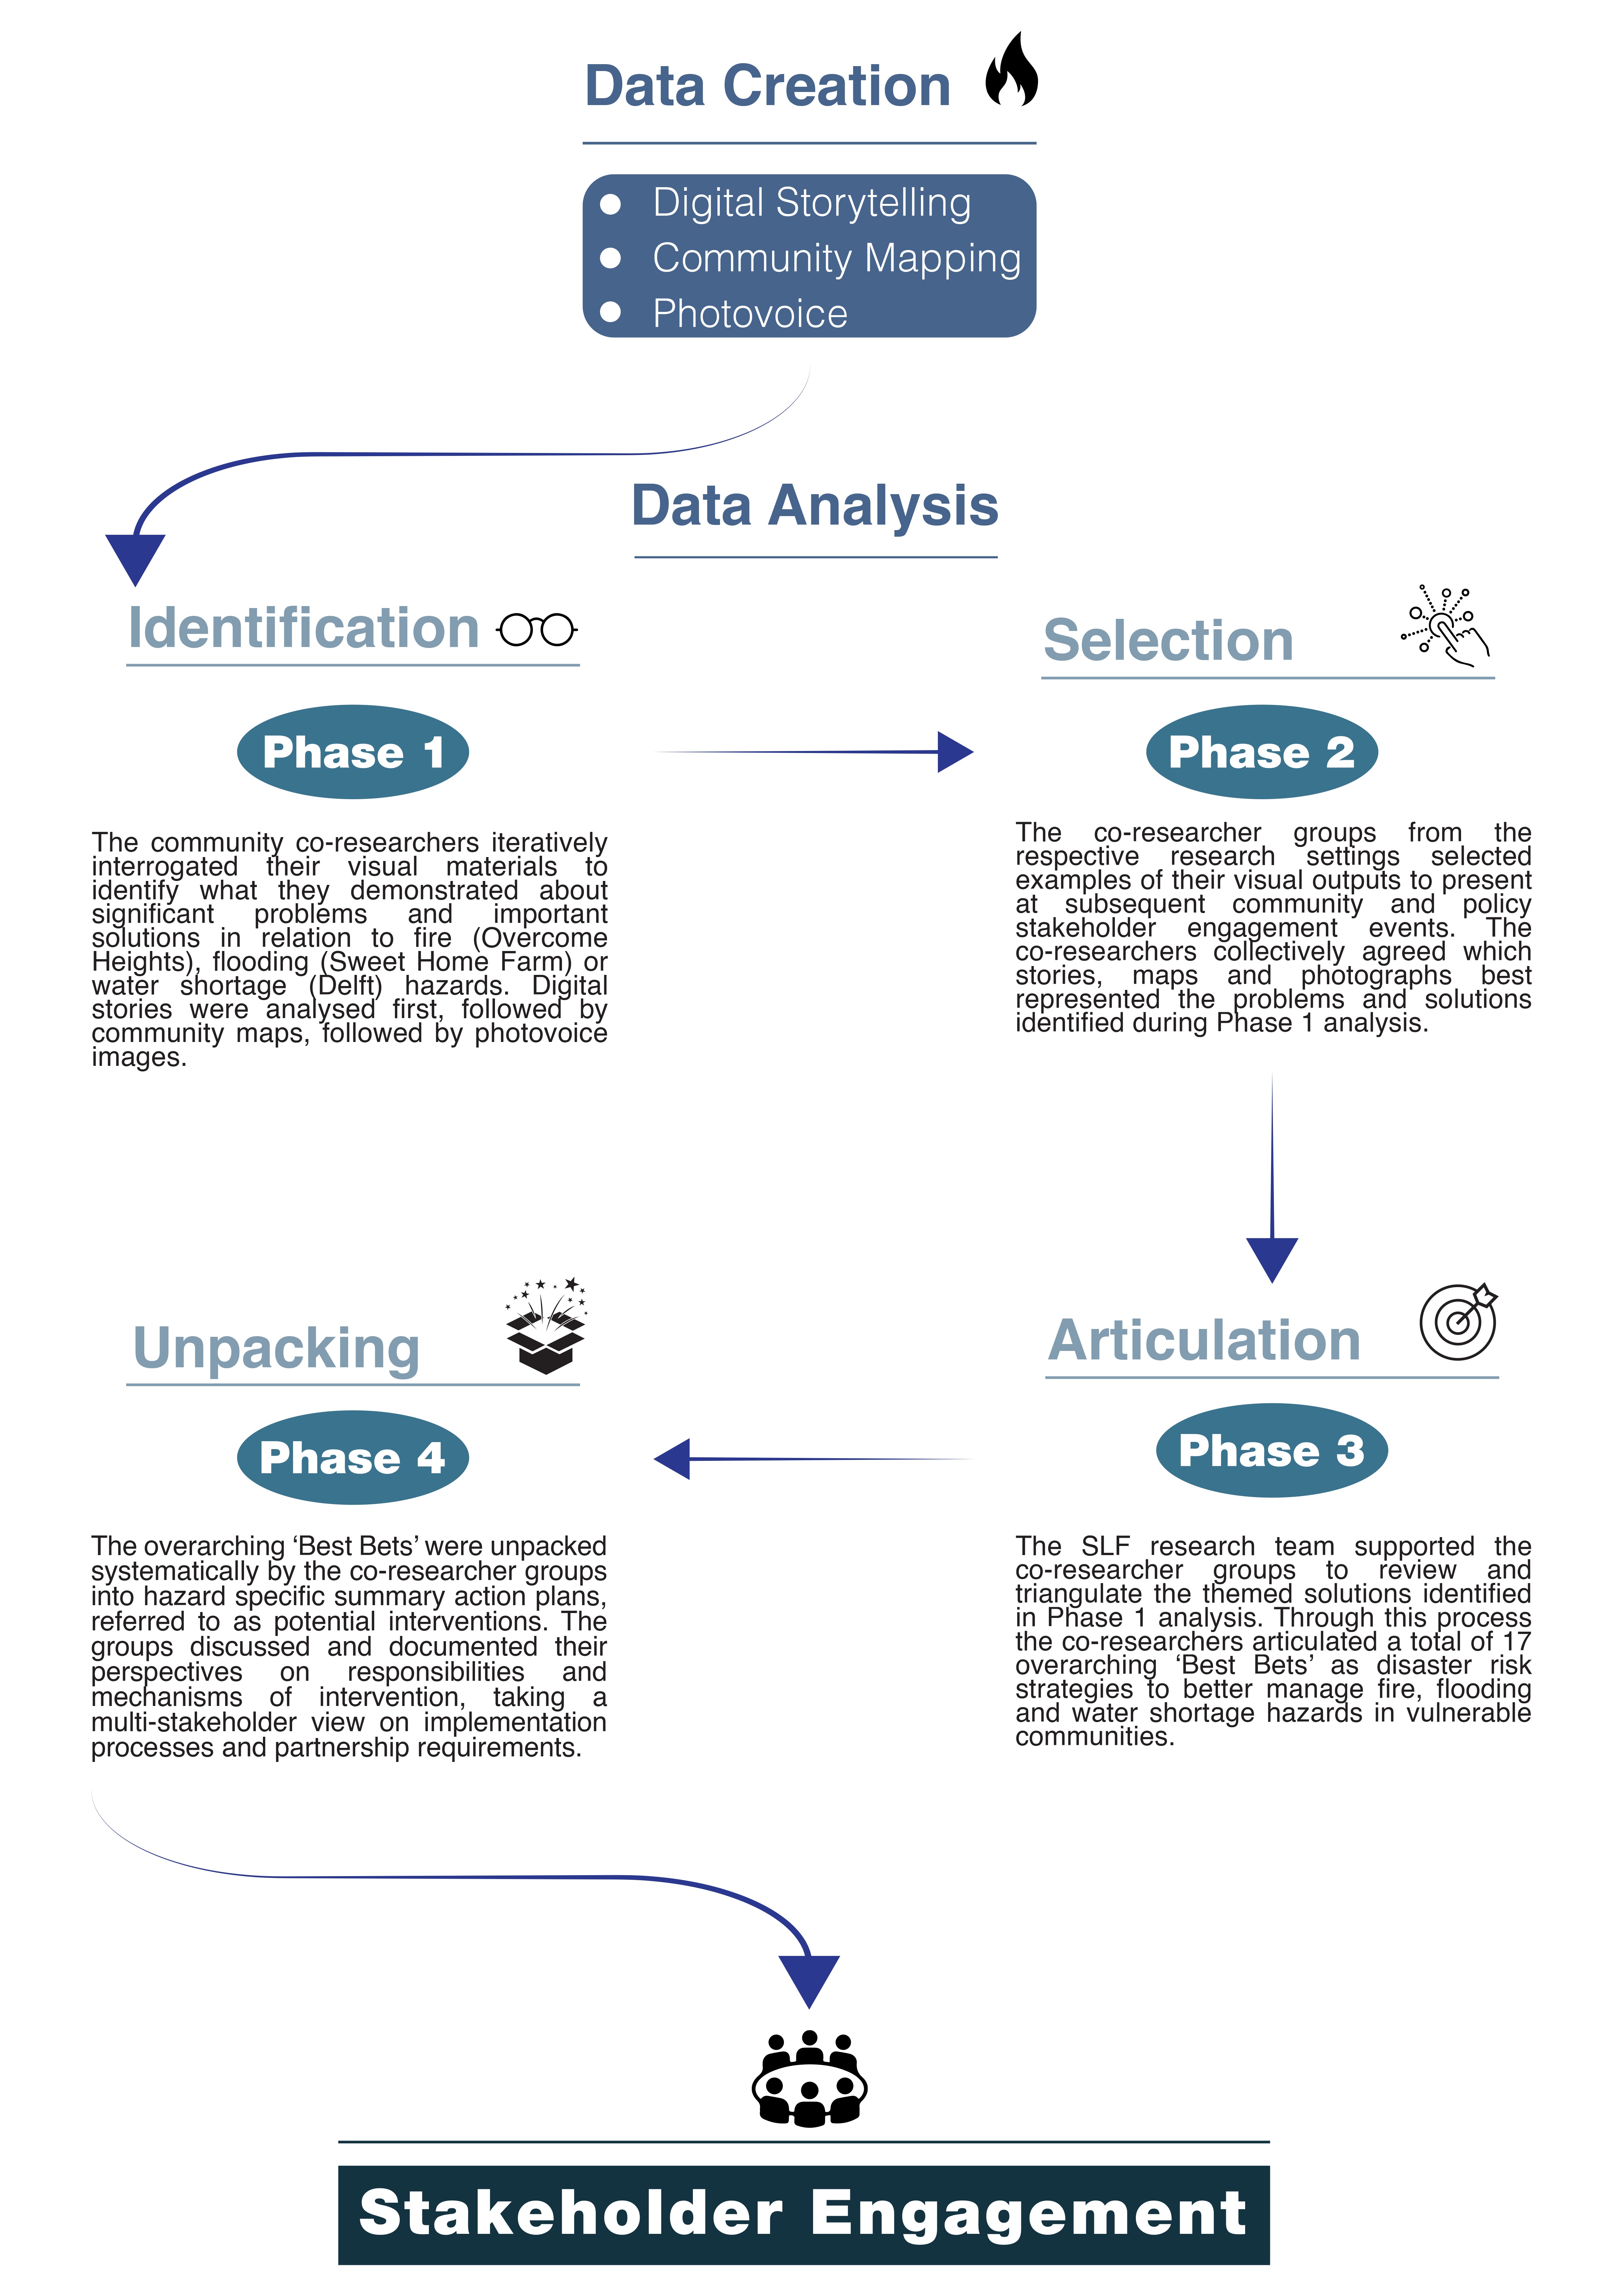
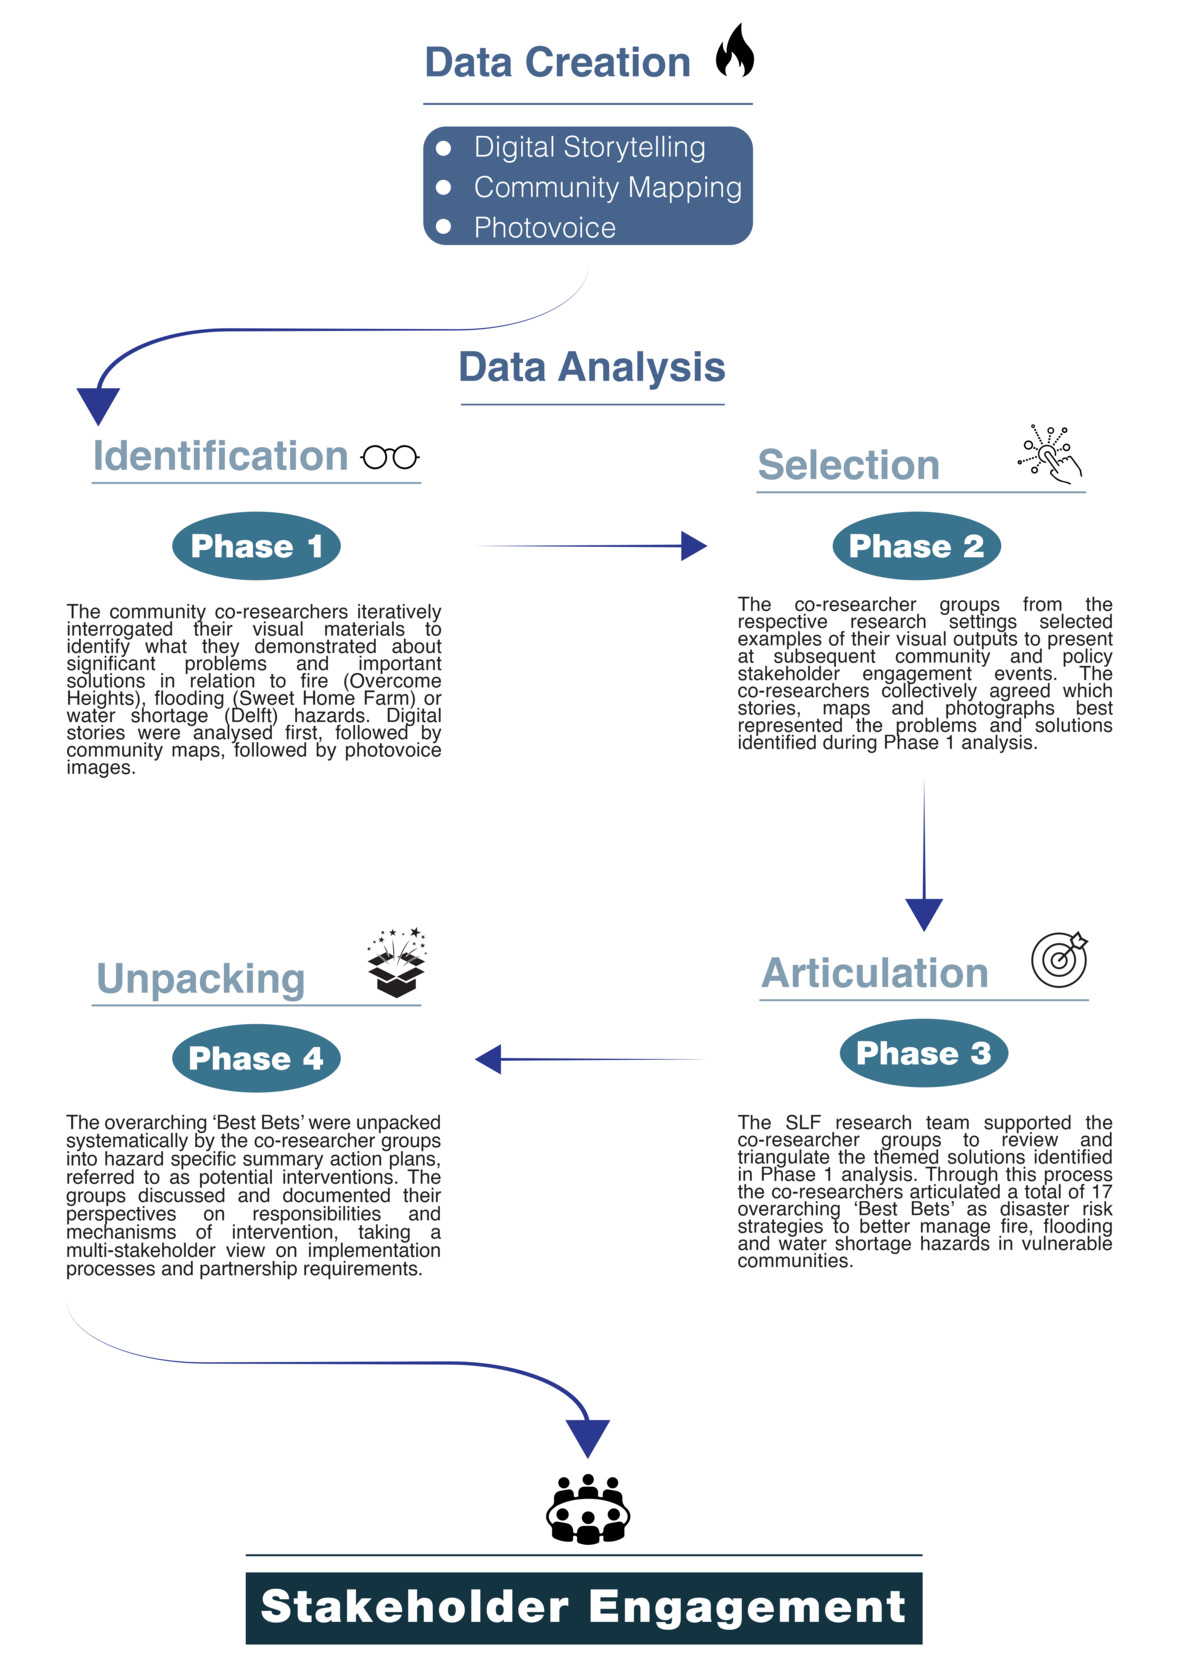
Following the completion of all three visual methodologies in each research community, the SLF team facilitated four distinct phases of participatory analysis and democratic decision-making amongst co-researchers from each research community. A flow chart outlining the process of analysis and the timings (phases) of each activity is shown in Figure 1.
Prior to phase 1 analysis, the SLF team held meetings with the three co-researcher groups separately to discuss the central aim of the analysis process which was to compile a series of community-derived potential interventions for disaster risk management. These potential interventions were to be presented as ‘Best Bets’ to strengthen community adaptation at engagement events attended by other residents of their communities, government officials and additional stakeholders, and via wider national and international channels.
Phase 1: Identifying problems and solutions through iterative thematic analysis
Firstly, the co-researchers iteratively interrogated their visual materials to identify what they were illustrating with regards to the most significant problems experienced by community members in relation to fire outbreaks, flooding, and water scarcity. When considering problems, the co-researchers were asked to consider ‘what makes this hazard worse?’. The analysis also involved the co-researchers in identifying what they perceived to be priority solutions to address these environmental hazards. When considering solutions, the co-researchers were asked to consider ‘what makes this hazard less bad?’. Co-researchers were not asked to find solutions that directly remedied the problems they had identified, but rather to draw out any important solutions that were conveyed within in their visual outputs. The phase 1 analysis was undertaken in the same order as the visual methods such that the digital stories were analysed first, followed by the community maps, followed by the photovoice images.
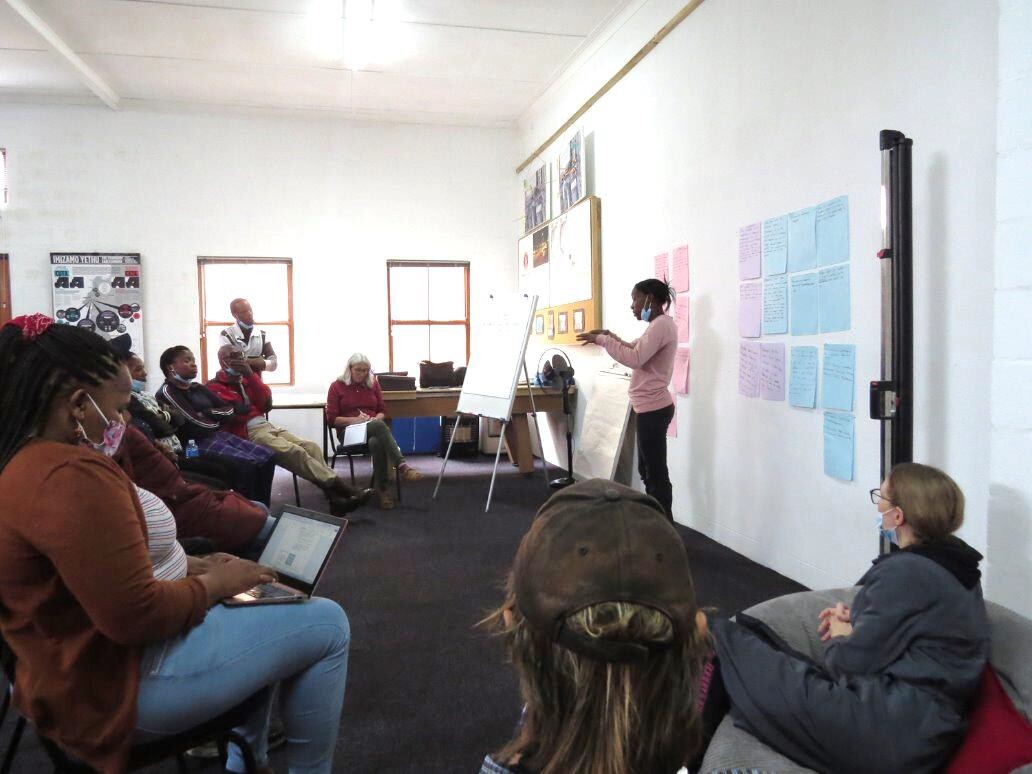
Digital stories: For each respective research site/disaster risk challenge, the co-researcher group collectively watched the entire compilation of their digital stories, back-to-back. The SLF facilitation team then requested the co-researchers to work individually and document (on sticky notes that were subsequently shared with the whole group) in only a few words what they each saw as the ‘one big problem’ and ‘two best solutions’ conveyed through the digital stories when they considered them as a single data set. This was followed by another facilitated whole-group process, wherein the co-researchers viewed all the problems and solutions they had recorded, looked for similarities and differences, and thereby collectively identified recurrent, major themes (Figure 2). The most frequently recorded problems and solutions identified in the DSTs were ringfenced to inform analysis phases 2, 3 and 4.
Community maps: A similar approach was taken for the phase 1 analysis of the community maps. For each research site, all community maps were exhibited in a gallery format as a single data set. The co-researchers were asked to work by themselves to identify and record any problems or solutions they saw as significant, other than those that had already been ringfenced through the DST analysis (Figure 3). As for the DSTs, the most commonly recorded problems and solutions identified in the community maps were ringfenced to inform the subsequent phases of analysis.

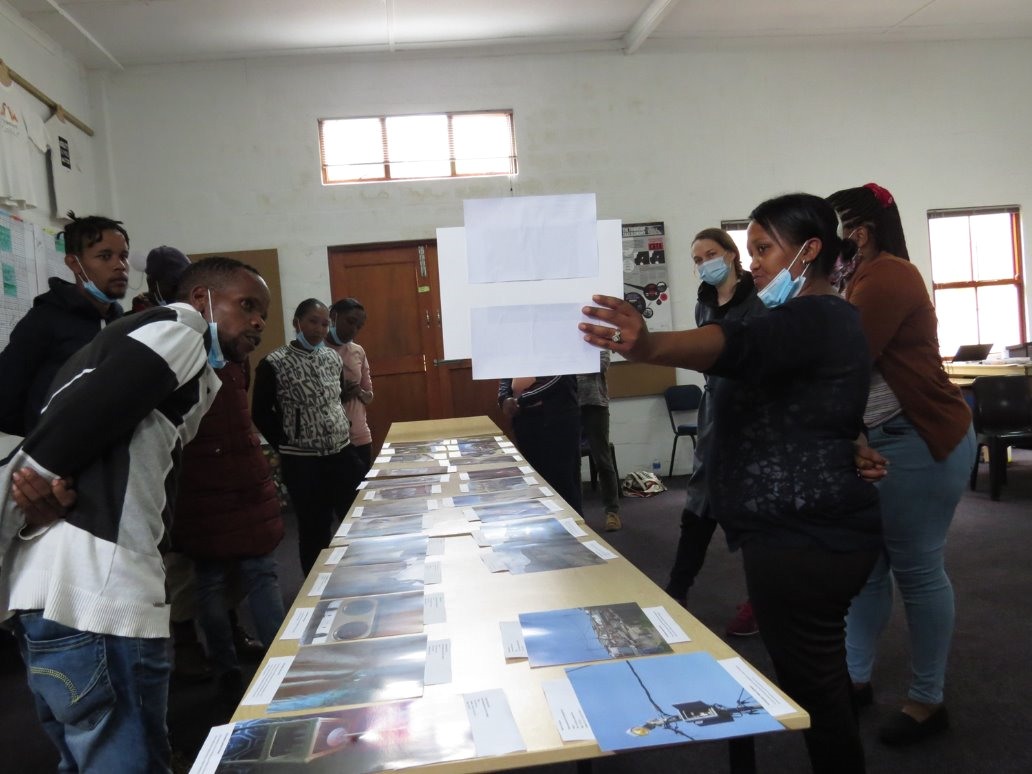
Photovoice images: The same steps as above were taken for phase 1 analysis of the photovoice images. The ‘most voted for’ images (see above) previously chosen by the co-researchers from the corresponding communities were displayed in a gallery format as a single data set. The co-researchers were asked to, individually, identify and record any problems or solutions they saw as significant other than those that had already been ringfenced through the analysis of the DST or the community maps (Figure 4). Once again, the most commonly recorded problems and solutions detected in the photovoice images were ringfenced to inform analysis phases 2, 3 and 4.
The SLF research team documented the phase 1 discussions, collated the problems and solutions that were identified by the CBCRs and shared them back with the co-researchers for confirmation.
Phase 2: Selection of visual materials for engagement events
Secondly, after the most frequently identified problems and solutions had been ringfenced for each type of visual methods output (digital stories, community maps, photographs) the co-researchers selected examples of these visual outputs to present at subsequent community and policy engagement events. This selection process also followed a democratic decision-making procedure wherein the co-researchers from the respective research settings collectively agreed which stories, maps and photographs best represented the priority problems and solutions identified during the Phase 1 analysis process. These presentations were given at subsequent engagement events to advocate for the ‘Best Bets’ as potential interventions to address environmental disaster risk.
Phase 3: Triangulation of the data to develop ‘Best Bets’
In the third phase of participatory analysis, the SLF research team supported the CBCRs in a review and triangulation (Carter et al., 2014) of the themed solutions that emerged via the phase 1 analysis. Through this process the co-researchers formulated a series of overarching Best Bets as disaster risk management strategies. At this point, emphasis was placed on the solutions that had been identified, rather than the challenges, as it had been envisaged from the outset that the Best Bets would be solutions oriented as opposed to focusing on problems.
For each method in turn (DST, community mapping and photovoice) the co-researchers considered the suggestions that ranked in the top 2 most frequently cited solutions (Tables 4, 5 and 6). In whole group discussion, the co-researchers decided whether these high-ranking solutions were indeed what they collectively considered to be the highest priority interventions to address the disaster risk under exploration in their community. If a nominated thematic solution ranked first or second for more than one method (e.g. DST and photovoice) and had already been nominated as a Best Bet (e.g. DST), the next highest-ranking solution identified through the latter visual method was considered. Where there was a tie, the co-researchers collectively discussed and agreed which solution was of higher priority to be included in their assemblage of Best Bets. The co-researchers continued with a process of review, discussion, and decision-making until all of the Best Bets to address their contextual challenge had been agreed upon.
Phase 4: Unpacking the Best Bets into potential interventions
In the final phase of participatory analysis, the overarching ‘Best Bets’ were unpacked by the co-researchers into more detailed summary action plans, referred to as potential interventions. At a workshop held at the SLF premises, co-researchers were randomly allocated into two small working groups comprising four to five people in each group. Working sequentially through all of the Best Bets in turn, the small groups were asked to work together to document four distinct sets of responses to the following linked questions: What activities are needed to implement this Best Bet; rationalize why these particular activities are needed; propose who is responsible for implementing these activities; outline how the proposed activities could be implemented (i.e. what would be the mechanisms for implementation); indicate when these activities would be most useful (before, during or after a fire, flood or episode of water scarcity). Each individual participant was asked to contribute their own ideas into these sessions. In contemplating the questions about who is responsible, the CBCRs were encouraged to think widely and consider role players such as NGOs and the private sector. The two groups then came together in a facilitated process to review the sets of four responses they had each given to the questions about what, why, who, how and when, for each Best Bet. During this review process, the co-researchers elaborated upon their responses and identified similarities and differences between them. Through this process of democratic discussion and debate, the co-researcher groups for Overcome Heights, Sweet Home Farm and Delft collectively generated a series of potential interventions that were specific to each Best Bet. Further goals of this phase of analysis were to shape the Best Bets into a presentable format for subsequent stakeholder engagement events, and to support the CBCRs in preparing to present them. The potential interventions were thus documented in Table form and formatted with accompanying imagery for presentation.
Findings
Building on the household surveys, the layered visual methods process produced a total of 25 digital stories, 47 community maps and 95 ‘most voted for’ photographs across the three research settings. These visual outputs were ringfenced as data for participatory analysis and exhibition pieces. The number and type of visual materials created by the co-researchers from each distinct research site is shown in Table 3.
Digital stories: The digital stories conveyed lived everyday experience as articulated by the CBCRs themselves, in their own words. Beginning with DST allowed the CBCRs to see they were not alone in the fire, flooding or water shortage challenges they had encountered personally and, in their households. The process also supported the co-researchers to show the immediacy and urgency of their shared experiences by illustrating their actions, trauma, constraints, and responsiveness, ‘in the moment’.
Community mapping: Moving on to the community mapping supported the CBCRs to more broadly contemplate the environment and wider local context in which the lived experiences shared through the storytelling are situated. The mapping activities supported the co-researchers to identify significant locations that were related to the types of challenges, limitations, possibilities and opportunities recalled through the stories or in relation to similar experiences. The selection of these locations and was entirely led by the CBCRs.
Photovoice: Participant chosen images and visual narratives allowed for further prioritising of disaster risks and development needs using visual and written evidence produced by the co-researchers themselves. Progressing to photovoice supported the CBCRs: to pinpoint and visually capture places, situations, conditions and objects of significance identified through the community mapping process. Further, photovoice provided an opportunity for the co-researchers to consider the environment and local context, add on to the knowledge and findings surfaced through the storytelling and community mapping processes, and pinpoint any places of importance they may not have captured during the community mapping activities.
The purposeful ordering of the three methods allowed for connections of place, experience and needs to be strengthened over time between the individuals in the CBCR groups from each community. In addition, the iterative process enabled a continuum of co-learning and a gradual accumulation of understanding among the CBCRs and supporting researchers regarding the environmental hazards being explored. Knowledge about disaster risks and potential opportunities for intervention expanded with each step. By drawing on the creative outputs of individual co-researchers, examples of how knowledge and understanding grew from one method to the next are shown in Appendix 1 (Overcome Heights), Appendix 2 (Sweet Home Farm) and Appendix 3 (Delft). All of the creative outputs were well suited for public presentations, and also future academic analysis.
The process revealed the value of co-learning as the CBCRs learned from one another about what they can do to better ‘protect’ themselves and their households in preparation and response to fire, flooding, or water scarcity, and where they can find help. Furthermore, the process allowed for growth in the autonomy of the CBCRs which both grew their independence and agency with each consecutive method, while also advancing ownership of the data production process. Upon weaving together the rich tapestry of findings, this research revealed the depth and complexity of experience, mitigation possibilities (and impossibilities) and the scope for resilience in the participating communities. The qualitative outputs increasingly, and strongly, reflected the perspectives of the research CBCRs themselves, as opposed to the views of the researchers, reinforcing the intended democratic nature of the research. In summary, the progression of co-learning comprised i) an interactive reflection of shared experience ii) building collective knowledge of the problems iii) identification of common needs iv) co-formulation of potential interventions to address these common needs.
Identifying problems and solutions through iterative thematic analysis
In Tables 4, 5 and 6 below, we summarize the findings that surfaced from the different stages of participatory analysis. Thematic solutions are presented according to the frequency with which they were suggested by individual co-researchers; the most commonly identified theme is indicated at the top of the list in the ‘problem’ and ‘solution’ columns.
Triangulation of the data to develop ‘Best Bets’ and unpacking the Best Bets into potential interventions
The total number of community-derived Best Bets formulated by the co-researchers from Overcome Heights, Sweet Home Farm and Delft respectively were 5, 6 and 6, comprising a total of 17 overarching solutions. In small group discussions, the CBCRs from the three communities unpacked their Best Bets to draw up more detailed potential interventions. First, they documented what needs to be in place for these solutions to be realized and justified the rationale for these needs. Second, they documented how the interventions could be implemented including which stakeholders held responsibility and should be involved in the implementation. Examples of the potential interventions derived by the CBCRs from Overcome Heights, Sweet Home Farm and Delft are shown in Tables 7, 8 and 9 respectively.
Whereas the CBCRs were asked to identify different types of problems and solutions with each iterative process of analysis, in some cases the same problems and solutions were highlighted in the stories, maps and photographs. This demonstrates the prominence of repeated problems and the exigence of restated solutions. It was interesting to note that although some problems or solutions were cited multiple times, the frequency with which (number of times) they were identified/flagged by the co-researchers differed according to the type of visual output. For example, the close proximity of shacks was mentioned as a problem more frequently through the community mapping analysis than the DST analysis. This supports the approach of using multiple methods of enquiry to explore what is fundamentally the same research question. In each case, and perhaps unsurprisingly, many of the proposed solutions spoke directly to the problems that had been raised. This finding substantiated the solutions-oriented approach, the sequential layering of the visual methods and the triangulation of the data to formulate the ‘Best Bets’.
Evaluation with CBCRs
The SLF research team ran feedback sessions with three CBCRs from each research setting with the aim of understanding the community members’ perspectives of the research process and their involvement in it. These feedback sessions took the form of collective interviews and were held towards the end of the project, one week prior to the final (fourth) stakeholder engagement event. During these sessions, the CBCRs expressed what they had learned through their participation and reflected on aspects of the methodology that had influenced their learning and opinions of the work (Piper et al., 2024). All respondents mentioned learning what they could do themselves, within their households and communities, to mitigate the risks and impacts of fire, flooding or water shortage. The interviews demonstrated that different types of learning were gained through each of the visual methods. A CBCR from Overcome Heights said:
‘‘Most of the learning came out of our discussions and the other people’s [CBCRs] experiences. I could actually take from what I’ve learned here at the workshops and implement it there [at home] and it helps. It was basically here at the workshops that we’ve learned most of the stuff how to deal with our fires and the situations that we face’’.
A CBCR from Delft said:
‘‘I would say like each thing we did was like a build-up and each message we got was like a piece of a puzzle that we had to reveal ourselves. So, I would say like each part of everyone’s story generated into us taking that little info to our own household so that you can implant it in your own house. So that you know that if something happens okay, there would be backup there help you’’.
Most of the CBCRs also mentioned having better communication skills as a result of sharing their experiences with other co-researchers and community members and presenting their ideas and insights to multiple stakeholder groups including government officials. A CBCR from Delft expressed:
‘‘I’m not gonna say I’m a different person as when I started, but there is improvement. For number one I couldn’t speak in public, I couldn’t do networking. But the methods that we used, it gave me the confidence to open up to speak to people to be myself. So yeah, I’ve learned a lot about different kinds of method, different kinds of ways how to deal with things and how to go about handling things’’.
When asked what they thought could have been done differently to improve the research process, there was some consensus that the lag time between the separate visual methods activities, and the gap between the field based enquires and the stakeholder engagement events, was too long. This quote from a Sweet Home Farm co-researcher demonstrates the point:
‘‘The time mustn’t be long that they [the informal settlement residents] are waiting without any feedback because it’s been long they were waiting there in Sweet Home Farm. They say, ‘why were they asking for that information if they can’t help us?’ But they still have hope that one day maybe something good will come out from that project’’.
Challenges
To be effective, this type of creative participatory approach requires considerable resources and access to technology and the internet. There is a practical need to get CBCRs well briefed, confident and familiar with the process beforehand. Further, the development of research outputs has considerable reliance on strong underlying avenues of enquiry, clear research questions, and leans heavily on participatory skills of the research facilitators to guide the development of visual outputs and their analysis. This inevitably limits the role of CAB members and co-researchers, who have relatively less research experience, in facilitating these processes on their own. The in-depth nature of the entire participatory process limits the number of participants that can be involved.
Whereas this research approach provided an important ‘snapshot in time’, the impacts of climate disasters such as localised flooding are largely seasonally related. Our team made best efforts to conduct research as close as possible to the season of relevance to the climate-related challenge. For example, the Sweet Home Farm DST process was facilitated in the winter months when rainfall is common and flooding most frequent. Conversely, in Delft the research was conducted at a time when water shortage was largely being experienced as a consequence of inadequate infrastructure; the municipal water supply was not under restriction due to drought conditions, as it had been in 2018. Thus, water-related risks to health and well-being were lower than they had been 4 years earlier. The lack of immediacy of the climate-related problem could potentially shape the participant responses to enquiry. However, given the profound nature of the 2018 ‘water crisis’ it is likely that the memory of living with these risks was deeply embedded in the CBCRs memories.
With respect to the CBCRs, it is possible that those who participated in the project were a biased sample of more civic minded, aggrieved and politically motivated individuals. Furthermore, given the length of the process and the substantial commitments that were required, we were unable to retain a completely uniform group of co-researchers throughout the duration of the project. However, while some CBCRs left and others joined part-way through the process, the majority remained involved throughout the research and participated across the full range of methods.
The qualitative components of the research, whilst concentrated into blocks of field work required substantive investment of resources. For example, in this process the services of a professional photographer with experience in participatory research was required to coach the co-researchers in technical photography skills. Further, human geographers supported the development of map products, facilitators with deep and ongoing field experience in the researched communities were required, and both technology and facilitators skilled in its application were necessary.
Conclusions
This research confirms that participatory visual methods are effective for engaging and involving community members as co-researchers in a research process, and illustrating lived experiences in ways that cannot be as powerfully communicated or understood through spoken or written words alone. Our findings demonstrate the value of authentically revealing and interrogating the experiential local knowledge of affected community members through their own eyes and in their own words.
By building onto a quantitative household survey with subsequent layers of qualitative visual enquiry, the approach described here generated a compounding learning experience in the participatory investigation of climate-related hazards and possibilities for adaptation in at-risk settings. Digital storytelling, community mapping and photovoice were effective for enabling affected community members to contextualize and progressively show the localised and varied impacts of fire, flooding, and water scarcity in their communities. The order in which the methods were implemented allowed the co-researchers to gain increasing autonomy as the enquiry evolved from contemplating personal experience to generating evidence for community wide impacts. The progression of co-learning comprised an interactive reflection of mutual experience, building collective local knowledge of shared problems, identification of common needs and co-formulation of potential interventions to address these needs. These findings substantiated the sequential layering of the visual methods, the triangulation of the data and the solutions-oriented approach to formulating the ‘Best Bets’. Moving between different methodological ways of considering problems and solutions, different timescales and different physical spaces enabled a rich, multidimensional understanding of co-researchers experiences and perspectives to unfold.
The methods also trained and supported the community co-researchers to be integrally involved in the analysis and interpretation of the data, and to identify possibilities for remedial action by community, government, and other stakeholders such as NGOs, including opportunities for partnership. This has meant that the Best Bets are grounded in both community relevance and practicality. The triangulation approach taken in the participatory analysis supported the researchers in describing and showing what they can and cannot do to counteract fire, flooding, and water scarcity, identify where assistance is or is not available, and pinpoint key gaps in responsiveness and support. Furthermore, the visual materials created provided important platforms for the co-researchers to present their own findings and ideas for disaster risk management at subsequent stakeholder meetings.
The study findings were enriched and deepened by the considerable amount of time that the SLF team spent working closely with the co-researchers, including the immersion of the research team in the research environment at various points. Further, the SLF team were able to draw upon their wider knowledge of the research settings and the broader policy, political and management landscape within CoCT and elsewhere to support the shaping of findings and proposed Best Bets solutions. It is important to note that the time-consuming nature of participatory visual methods processes such as the one described here can pose a significant challenge, especially for the retained participation of community co-researchers. Research of this nature also depends on multiple resources and access to technology. A further factor to consider is ensuring appropriate modification for the investigation of different environmental hazards in different contexts. For example, exploring water scarcity in a large area like Delft is arguably more complex than investigating flooding or fire outbreaks in relatively small settlements like Sweet Home Farm and Overcome Heights. Whereas democratic processes are highly important, there is a need for careful facilitation to ensure that community partners remain pragmatic regarding their expectations of themselves and their fellow community members, and their anticipation of what can practically be achieved by research teams and local government.
Our findings highlight the multi-functionality of visual methods as instruments of creativity within the process of co-production, not just as a technique to make visible subaltern forms of knowledge from marginalised groups, but also as a mechanism to promote knowledge mobilisation (Adelle et al., 2022). We conclude that, with adequate resourcing, the participatory visual methods approach taken in the ‘Water and Fire’ project can be used as a model to strengthen the mobilization of local knowledge and further possibilities for community-derived disaster risk management in the context of advancing climate change. Insights from this study contribute to better understanding prominent challenges and promising solutions that could inform policy development and disaster risk reduction strategies to strengthen climate change resilience in cities in low- and middle- income countries. We further propose that this model has the potential to involve affected community members in generating solutions for other development challenges of global significance and to advance possibilities for equitable, inclusive, and ethical research.
Funding
This research was funded by a grant from the United Kingdom Research and Innovation Global Challenges Research Fund (UKRI GCRF) awarded to the University of Stirling (project number 100671).
Acknowledgements
The researchers acknowledge and thank all of the community-based co-researchers from Overcome Heights, Sweet Home Farm and Delft for their committed participation in the study.
We recognize the crucial role played by Anthony Muteti, Carol Masingi and Phumzile Ntozini in co-facilitating the visual methods workshops.
We are grateful to Archer Drummond for designing Figure 1.
In writing this paper we remember community-based co-researcher Emihle Mani who was killed in a shack fire in Sweet Home Farm in April 2024.