

Introduction
After nearly three years of decline in violent crimes from 2016–2019, recent FBI reports show that crime is on the rise. Violent crimes in cities with a population of fewer than 20,000 people followed similar trends. In 2020, residential properties accounted for the highest percentage of criminal activity (51%), followed by streets/alleys/sidewalks (19.3%), parking garages/lots (6.6%), convenient stores (3%), hotels/motels (2.5%), gas stations (1.7%), restaurants (1.5%), department stores (1.4%) and parks/playgrounds (1%) (FBI Crime Statistics, 2020). While most research shows that focusing policing efforts in small geographic places known to be high in crime can lead to a reduction in crime (Braga et al., 2019; Weisburd & Braga, 2019), these hotspot policing efforts are attributed to sophisticated crime analysis technologies available in law enforcement agencies in larger cities. In their research, Weisburd and Telep (2014) identified the need to examine such approaches in smaller cities.
Recent public demands for changes in traditional policing highlight the need for citizen participation in crime prevention efforts (Choi & Lee, 2016). One promising crime prevention technique is Crime Prevention through Environmental Design, also known as CPTED. Originally coined by C. Ray Jeffrey in the '70s (Jeffery, 1971), Newman (1972) heavily used CPTED and Defensible Space strategies by involving community and stakeholders in the planning process in several of his projects at both building and neighborhood levels and his findings showed an overall reduction in crime and enhanced quality of life (HUD, 1996). CPTED’s four principles of Surveillance, Territoriality, Access, and Maintenance are based on using physical environmental features to reduce reported crime and fear of crime and enhance the quality of life. Although CPTED has become an ordinance adopted in many cities in the U.S., CPTED has been misconceived by many professionals as a strategy that focuses on target hardening, improvement of lighting, and increasing surveillance (Cozens & Love, 2015; Crowe, 1991). Recent research attributes these misconceptions to a lack of a clear definition and framework (Armitage, 2013; Gibson & Johnson, 2013; Johnson et al., 2014). While CPTED strategies strive to focus on the relationships between people and the environment by incorporating natural strategies that influence their behavior (Cozens & Love, 2015), it requires the active involvement of the community (Armitage, 2013; Cozens & Love, 2015). In their review of 64 studies, Gibson and Johnson (2013) found that some CPTED strategies were used more frequently than others. These misconceptions may have led to reduced effectiveness and less engagement from the community to embrace these strategies.
Numerous community-led efforts to implement CPTED strategies have shown a promising reduction in overall crime. Flint, Michigan, for example, has witnessed a 40 percent reduction in violent crimes across a five-year timeframe in street segments that were part of the Clean and Green program, a CPTED-based initiative (Heinze et al., 2018). While there is evidence that community engagement can be an effective approach to addressing crime prevention strategies, there is not, to date, an effective model to meet the different challenges associated with bringing the community together.
The Byrne Criminal Justice Innovation (BCJI) program is the largest federal effort in the U.S. to assist neighborhoods in building partnerships and engaging communities in implementing an array of place-based strategies to reduce crime and fear of crime. Hipple and Saunders (2020) evaluated the effectiveness of 60 sites that received a one-million-dollar grant from BCJI. These sites were mostly engaged with law enforcement strategies, such as “hot spot” policing, collective efficacy, Crime Prevention through Environmental Design (CPTED), social cohesion, blight remediation, economic development, and fear of crime. Despite efforts to advertise for community engagement, sites reported an average of 140 community participants and only a few reported several thousand. The inconsistency in community engagement measured by the number of participants suggests that these communities need a new set of policies, tools, and strategies to deploy when these circumstances arise.
To address this need, the research team tested a community-engaged participatory research approach from 2019 through 2020 that combined crime data, design, and engagement in developing the needed policies, tools, and strategies for crime prevention in three cities located in Michigan with populations of 20,000 or fewer people. The main focus of this research was to innovate crime prevention strategies and policies that are replicable and empirically supported. We first review planning literature that discusses community engagement models and review existing community-led initiatives that address crime. We then discuss in detail the seven methods used in the three communities. We conclude with a model that engages community residents and stakeholders to better understand the drivers of crime in high-crime areas.
Literature Review
Citizen participation in community decision-making dates back to Plato’s Republic where the concept of freedom of speech and equal representation set the basis for community meetings (Sanoff, 2005). Although the right to participate was at the forefront of democracy (Billington, 1974), the increase in population made it difficult for every citizen to participate (Sanoff, 2011). This led to a movement in the '60s to enable the public’s direct involvement in defining their physical environment (Davidoff, 1965). Several scholars argued that the environment is more effective if citizens actively participated in its creation (Rosen & Painter, 2019; Sanoff, 2000; Vaughn & Jacquez, 2020).
While numerous studies showed a positive impact in using community-based participatory research in enacting social change (see Brown & Stalker, 2018; Kral & Allen, 2016), citizen participation comes with many challenges (Caldwell et al., 2015; Israel et al., 1998). First, translating community participation into practice needs to be supported by a working model that bridges the gap between researchers and practitioners (Huffman, 2017; Mitchell & Shortell, 2000). Researchers attributed this gap to the lack of practical experience that researchers have in community engagement (Mitchell & Shortell, 2000). Second, collaboratively engaging a broad array of people can be complex (Caldwell et al., 2015; Lasker & Weiss, 2003). Third, retaining participants to run a community engagement process, in the long run, has also been found to be equally challenging. Reid (2000) examined community participation in seven communities in the U.S. and found that meetings represented by a diverse group had higher participation rates. He also found a positive correlation between outreach efforts and attendance, and equally stressed the importance of the role played by facilitators in ensuring that all voices are heard. Fourth, Keahey (2021) and Livingston (2022) reported academic barriers to advancing community-based participatory research, such as the difficulty in disseminating knowledge in prestigious papers (Whitzman, 2017) and lack of support from universities that do not count such efforts as achievements in the tenure process (Kawabe et al., 2013). Lastly, Van Maasakkers and Oh (2020) highlight the need to strategically consider an appropriate venue that supports participation and collaboration.
Scholars from different disciplines use sophisticated participatory research methods such as community-based participatory research (CBPR) or participatory action research (PAR) to produce projects that meet the needs of the community (Huffman, 2017). Both methods are based on participation, action, and community. Daepp et al. (2021) showed that the use of the PAR method is feasible when residents, community organizations, and academic researchers collaborate. Keahey’s (2021) systematic review of 72 studies showed that researchers relied upon purely quantitative, qualitative, or mixed-methods approaches to address a community engagement problem. While most researchers used a variety of activities to increase participation (Godden, 2017), Huffman (2017) showed that there has not been a single framework of steps to follow.
Within crime prevention studies, researchers have used similar approaches to empower communities to develop practical solutions to address crime in their communities. Studies demonstrating that community engagement led to decreased violence in their cities are promising but scarce (Rupp et al., 2020). Additionally, studies that were engaging to residents either addressed physical disorder or focused on aspects of the social environment. Physical disorder is measured by environmental features like blight, lighting, littering, poor landscaping, or abandoned lots. Kochel and Gau (2021) referenced cohesion and informal social control as measures of the social environment. Cohesion is exemplified in social ties among neighbors that allow them to trust one another and protect their environment, while informal social control is the willingness of neighbors to intervene on behalf of the common good when they see a problem in their area (Kochel & Gau, 2021; Sampson et al., 1997). Both terms, when combined, are known as collective efficacy.
Fabusuyil (2018) examined the impact of social cohesion and informal social control in a Pittsburg, Pennsylvania, neighborhood from 2008–2012. The experiment required an existing community organization to acquire properties that were identified as crime hotspots. Fabusuyil (2018) later engaged the community in driving informed decisions through town hall meetings, social events, and outreach events. Together, they proposed physical changes, but also enforced regulations that allowed them to recruit place managers at certain locations. The findings showed an increase in trust and collective efficacy among the residents, and the physical and social environments of the acquired properties had an overall crime reduction of 49%. This finding is aligned with the “social disorganization” theory, which posits that crime happens when community relationships are non-existent (Sampson & Groves, 1989).
Despite the effectiveness of community engagement strategies in addressing crime, we identify six gaps. First, because of the inconsistency of the methods used across different communities and the complexity of addressing crime prevention strategies, some communities were not as successful in their crime prevention efforts (Hipple & Saunders, 2020). Second, little has been done to examine crime hotspots within smaller-sized communities (Weisburd & Telep, 2014). Third, there is a lack of knowledge dissemination in workshops that involve communities. Several scholars argued that public perception of crime does not often align with reported crimes (Willis, 2010). Additionally, due to limited resources, not all law enforcement agencies have access to sophisticated crime analysis software or mechanisms to share their crime data with the public on a dedicated portal. Moreover, not everyone is comfortable intervening in neighborhood problems (Kang, 2015; Kochel & Gau, 2021). Lastly, scholarly work that examined community engagement in crime prevention studies focused on either the built or social environment—but not both.
This report highlights three similar CPTED planning processes conducted in three similar Michigan communities that address all the gaps in research as stated above. This project: 1) utilized consistent methods across each community; 2) examined crime hotspots in medium-sized cities; 3) utilized a combination of knowledge-sharing and crime perception exercises together in workshop settings; 4) the three public safety departments had similar infrastructure for sharing and analyzing crime data yet benefited from the research team’s crime analytics skillset and map development; 5) gained support from the steering committees in each city for addressing neighborhood and downtown crime due to the impacts it has on quality of life for residents and business owners; and 6) focused on both the built environment and the social environment with city leaders considering changes to zoning and code enforcement while also engaging with the Black Lives Matter movements to address social considerations.
Current Study
In this paper, we expand on PAR and CBCR principles and test a set of quantitative and qualitative tools in three mid-size communities. We showcase an approach for increasing participation and enhancing community engagement that leverages evidence-based strategies for addressing crime, safety, and other quality-of-life issues. Through our partnerships with residents, law enforcement, city and public health officials, and planners, we developed a set of strategies to attract participants, engage them in a variety of consensus-building activities to address crime and bolster placemaking, and conduct research data-sharing meetings, all of which resulted in the creation of an actionable plan that improves the safety and well-being of the communities. We also share the different challenges presented in each community. We conclude by presenting a model that bridges that gap between research and practice and highlights the importance of a research partner in community-led initiatives.
Methods
This paper proposes a model that expands on PAR and CBCR methodologies and addresses the gaps in community engagement literature. First, the research team is based in a tier-one public research institution. Their appointments with the university range from teaching-research-based appointments to service-based appointments, creating a balance among the team in terms of their university expectations. The team members come from different disciplines and have a track record of facilitating community engagement efforts in communities of different sizes throughout Michigan and nationwide. Therefore, the team was composed of a community development educator from a state university extension service, a planner, and a director of an institute within the university that is specialized in facilitating meetings, focus groups, workshops, and charrettes. The third team member has an academic appointment at the same institution with a specialization in architecture and crime prevention through environmental design. The fourth team member was a doctoral student from the university’s criminal justice program who has a track record of addressing violence in communities. The project received funding from the university’s Institute of Public Policy, which supported the research-service activities initiated by the team.
The project was overseen in each city by a steering committee made up of multi-department city staff, elected and appointed officials, and community leaders. Working with the three communities, the research team first developed a crime data snapshot for each community. The data showed where crime hotspots were located within the communities and how it had moved for the past two to three years. The team then engaged residents in collecting images of areas that are important to them using a participatory process called Photovoice (Strack et al., 2004). The images and crime snapshots set the stage for the design workshops. These workshops included a series of exercises designed to move participants through shared learning of CPTED and placemaking principles using their images, visioning, validation of crime data, designing placemaking plus CPTED interventions, and finally developing a CPTED Assessment Tool and policy recommendations and strategies to address crime.
Description of Case Studies
In this research, we partnered with three cities in Michigan: Adrian, Albion, and Howell. The selection of the cities was based on two criteria. First, all three cities represent medium-sized communities (in Michigan) with limited access to sophisticated crime analysis tools. Second, the community development extension educator on this research project represents these communities and has pre-existing relationships with city staff in each community. While Table 1 demonstrates the demographics for each city, we provide a summary of developments in each city:
Adrian. Geographically, it is in southeast Michigan in Lenawee County. About 40% of the existing homes within the city limits were built before 1939 and about 31% were built between 1940 and 1959. It is home to Adrian College and other public and private educational institutions. Many of the commercial areas in Adrian are in the downtown area and in the outlying township environs to the south and north of the city limits. Adrian has an active downtown development authority and is a partner with the State of Michigan in the Redevelopment-Ready Communities program.
Albion. Geographically, the city is in south-central Michigan, along the I-94 freeway corridor in Calhoun County. It has strategic access to transportation networks. There are small- to medium-sized manufacturing developments, craft production facilities, alternative energy, and an automotive supplier. Albion College has more than 452 employees and has partnered with the city to redevelop and revitalize the downtown area. Albion’s commercial and office districts include the downtown and the northern outlying areas in the adjacent township.
Howell. Geographically, the city is in mid-Michigan along the I-96 freeway corridor in Livingston County. It is considered a historic city with traditional downtown and core neighborhoods. About 24% of all housing units within the city limits were built before 1939 and 85% were built before 2000. Howell is home to a large K-12 school district, an active downtown development authority, and is known for its annual festivals that draw regional tourists.
Engagement Strategies
A steering committee was selected in each city to guide the CPTED planning process. Each committee was made up of a member of the city police or public safety department, the community development department or downtown development authority, the manager’s office, and the university’s extension. The steering committee meetings were facilitated by an educator from the university’s extension., and included, at the beginning, a training on public engagement tools and the CPTED process. Each committee then organized the first public kick-off workshop agenda and marketed the event as well as identified a downtown location for the event. Members of the committee also arranged transportation shuttles for the event (Adrian) and worked with local public agencies to broaden the diversity of attendees.
Each steering committee facilitated tabletop mapping exercises alongside the research team and welcomed attendees to the event. Post-kick-off activities included a review of crime data maps, crime perception maps, and placemaking maps that were developed before and during the kick-off event. The research team collected feedback from the steering committee on the three maps, including first impressions and reflections on the crime data in their respective communities.
Members of the steering committees operated under consensus when it came to kick-off planning and feedback on the deliverables. Feedback included being impressed by the activities and level of engagement at the event and during the Photovoice process. Members of the public and the steering committee were very positive about the CPTED process, with residents and leaders expressing how interesting the maps and activities were and that the outcomes (discussed below) were very impactful. Dissent among the members of all three steering committees was non-existent before, during, and after the CPTED process.
After the CPTED process completed its public engagement and mapping activities in 2020, the steering committees each met to review the elements of the final public presentation. This presentation was formatted as a “Leadership Roundtable” and was hosted online with the research team providing a review of all the CPTED process steps from beginning to end. In each city, council members, planning commissioners, and departmental officials and staff members were invited to engage in a final presentation of all the completed CPTED deliverables: maps, survey results, assessments, and recommendations. The research team and steering committee provided an overview of a block-by-block analysis of identified CPTED priority areas (those areas of the city that experience higher numbers of property and violent crime, and are therefore a priority for changes in design and policy). After viewing the presentation and hearing the recommendations, the leadership groups and steering committee members worked in small groups to discuss and comment on the recommendations and develop action steps for the city to address its crime hot spots. Due to the participatory nature of the process, dissent was non-existent and steering committee members and leadership were able to work together to create the next steps once the planning process transitioned into implementation.
Throughout the planning process, the steering committee and research team transitioned from in-person events to online events. The process included online photo submissions, the development of project websites and social media outlets, and online leadership roundtables. The pandemic hindered some aspects of the process and strengthened others. While photovoice engagement numbers were low across the three communities, online interactions and the leadership roundtables were well attended. These impacts will be addressed below in more detail.
Step 1: Recruitment and Marketing for Project Participation
From July 2019 through March 2020, recruitment mainly consisted of direct emails sent to local leaders and groups from the authors and steering committee members, spreading the word about the project and the Photovoice and other engagement opportunities. After the COVID-19 gap, each steering committee met monthly from June to August 2020, and the research team developed a new website and Facebook page for each community and planned an online August showcase and leadership roundtable. The websites and Facebook pages reached hundreds of people each week and served as the main conduits for sharing information about the projects. The websites served three main outreach purposes: sharing the community survey link; sharing the Photovoice project link; and providing news and updates a few times per month related to media pieces and the August Showcase/Leadership Roundtable. Although underway since December 2019, recruitment activities were impacted heavily by the onset of COVID-19 and subsequent lockdown orders put in place across Michigan in March 2020. Following Van Maasakkers and Oh (2020), all in-person activities were strategically planned in venues accessible to each of the communities and we provided transportation to improve participation.
Step 2: Photovoice Workshop
Photovoice was utilized during the planning process as a tool for residents to tell their stories of life in the respective cities. Photovoice is a participatory action research process that engages underserved persons using photography and storytelling. Specifically, it enables participants to document their perspectives of their communities (Strack et al., 2004). In three separate sessions completed in the winter of 2019, a certified Photovoice instructor trained members of each city’s steering committee on the Photovoice process. After completing the Photovoice training, the steering committee members actively recruited participants through their respective networks. Photovoice participants used digital photography to capture images in response to two prompts: 1) Provide a photograph that you took that best tells the story of what characteristic in your community you are most grateful for; and 2) Provide a photograph that you took which best tells the story of what characteristic in your community you think possesses the greatest opportunity for improvement. Across cities, Photovoice submissions were low as a result of the shelter-in-place executive order, which restricted participants’ abilities to leave their homes. Further, those who would normally dedicate time and effort toward the project found their responsibilities shifting to essential, pandemic-focused tasks, postponing all other work.
Step 3: Community Workshop
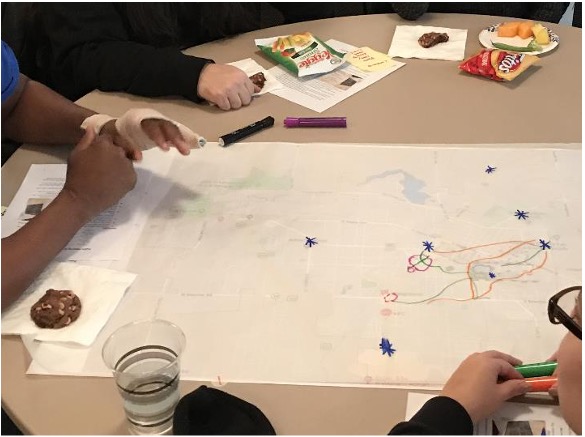
The community workshops were planned in person within each city. The research team engaged residents in several activities. To start, residents were asked to provide a one-word description of their community as it was at the time of engagement (Figure 1), as well as a one-word description of what they desire their community to resemble in the future. Following this exercise, the stakeholders were asked to share their understanding of CPTED. Then, the research team gave two brief lectures on CPTED and placemaking. Residents were then instructed to identify locations on a map where they would like placemaking activities to be implemented and provide ideas as to the types of placemaking activities at each identified location. Using the same map, residents were also asked to draw (additional) walking and bicycling routes (Figure 2) and identify safe and unsafe locations. At the end of the workshop, stakeholders were asked to rate the most meaningful activity and the least helpful activity.


Step 4: Community Survey
An electronic survey was constructed using Qualtrics Survey Software (version 2020) to understand residents’ perceptions regarding quality-of-life issues within their neighborhoods. The survey received approval from the author’s university’s Institutional Review Board (IRB). Furthermore, the survey included both Likert and open-ended questions that were informed by related literature within the fields of urban planning, criminology, and psychology. Participants were instructed to consider their neighborhoods and respond to questions regarding their level of social cohesion, informal social control, and physical disorder, as well as the level of fear of crime they generally experienced during the day and at night, the seriousness of the crime, and the adequacy of police presence. Participants were also instructed to respond to questions that addressed levels of surveillance and territoriality in their area as well as levels of placemaking activities. In addition, participants were asked to provide geographically identifiable information on locations within their neighborhoods where they felt either the safest or unsafe and to explain what it is about these locations that informed their responses. Regarding unsafe locations, participants were provided with a list of crime types (including descriptions) and asked to select any crime they are concerned about at each location. To gain a sense of what participants considered to be “their neighborhoods,” they were asked to provide the intersection nearest to their homes.
The research team had planned to provide opportunities for individuals to complete the survey at locally held community gatherings. Attendees could then choose to complete the survey at stationed laptops or request a paper version of the survey. However, the distribution of the survey overlapped with the onset of COVID-19. Due to COVID-19 restrictions, this plan was not able to be executed. Given the method of distribution and limited access to computers and internet subscriptions in some of these communities (see Table 1), survey findings are not representative of the populations of the three cities. However, survey findings do capture a portion of their populations that are of great interest: residents, businesspersons, and government officials who have a vested interest in community life, regularly participate in community events, and are particularly concerned about quality-of-life issues.
Step 5: Reported Crimes
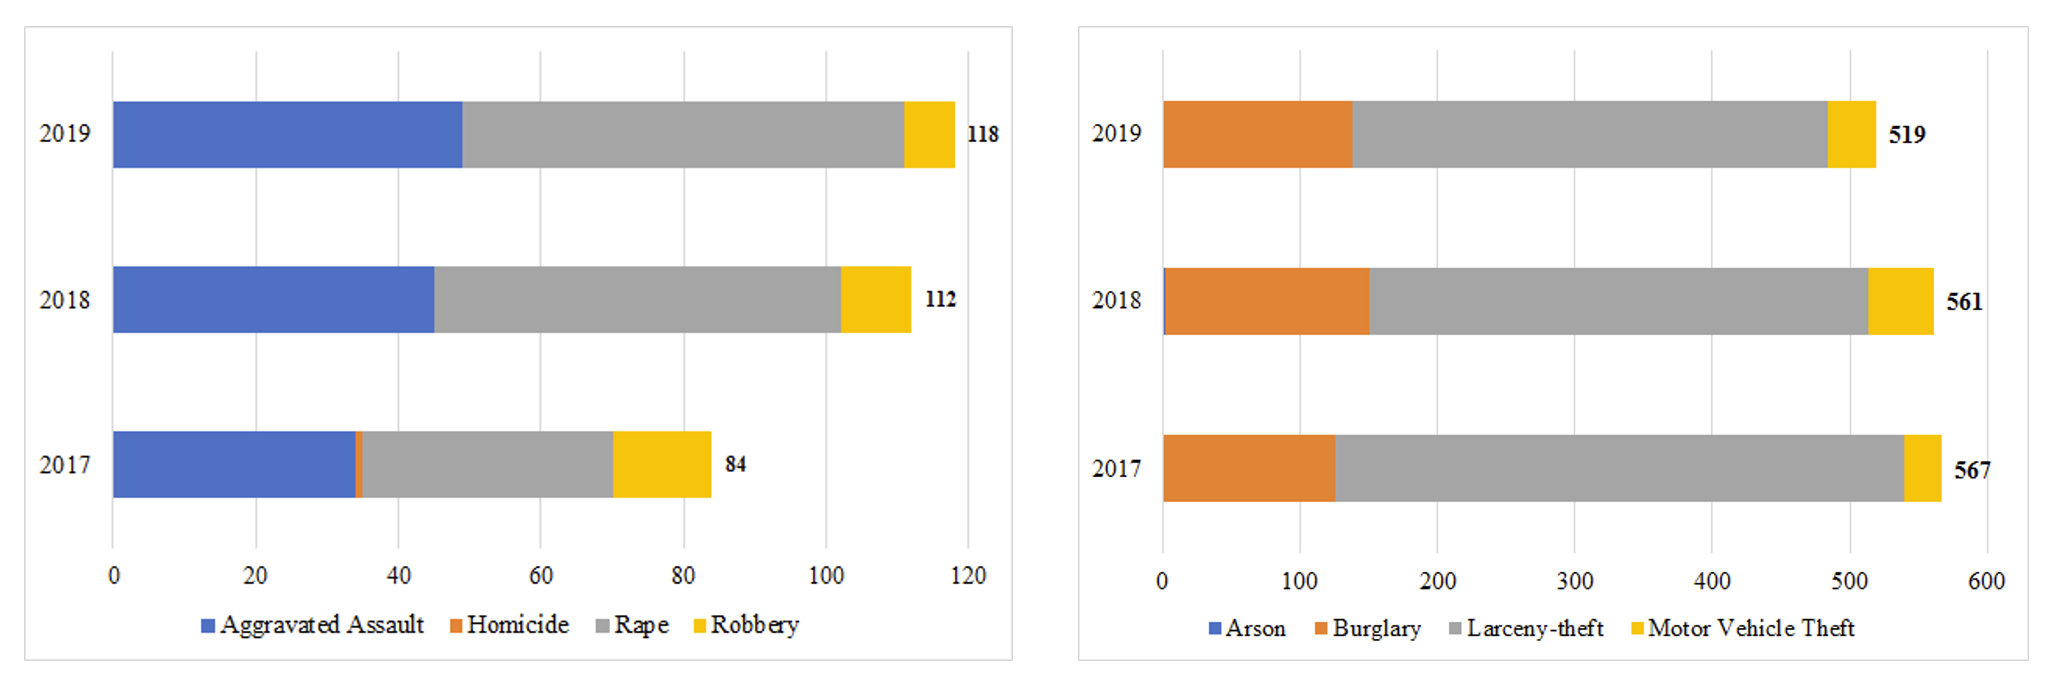
Reported incidents of violent crime (aggravated assault, homicide, rape, and robbery) and property offenses (arson, burglary, larceny-theft, and motor vehicle theft) were obtained from the police departments of two of the cities, while calls for service related to these offenses were obtained from the third city. These differences were because each police department uses a different system to track incidents. Some departments changed the system, making it difficult to obtain data prior to the year of the change. For example, we collected more than four years for Albion and Howell (2016—2019) and three years (2017–2019) for Adrian. Furthermore, these data contained address information for each reported incident or call, which were geocoded using ArcMap (version 10.8) to facilitate spatial analysis.
Step 6: Data Analysis
The research team adopted a mixed-methods approach to evaluate each community’s ability to effect change in public health, safety, and welfare through improved environmental design, policing, and community engagement. This approach consisted of five phases which drew from quantitative and qualitative methods.
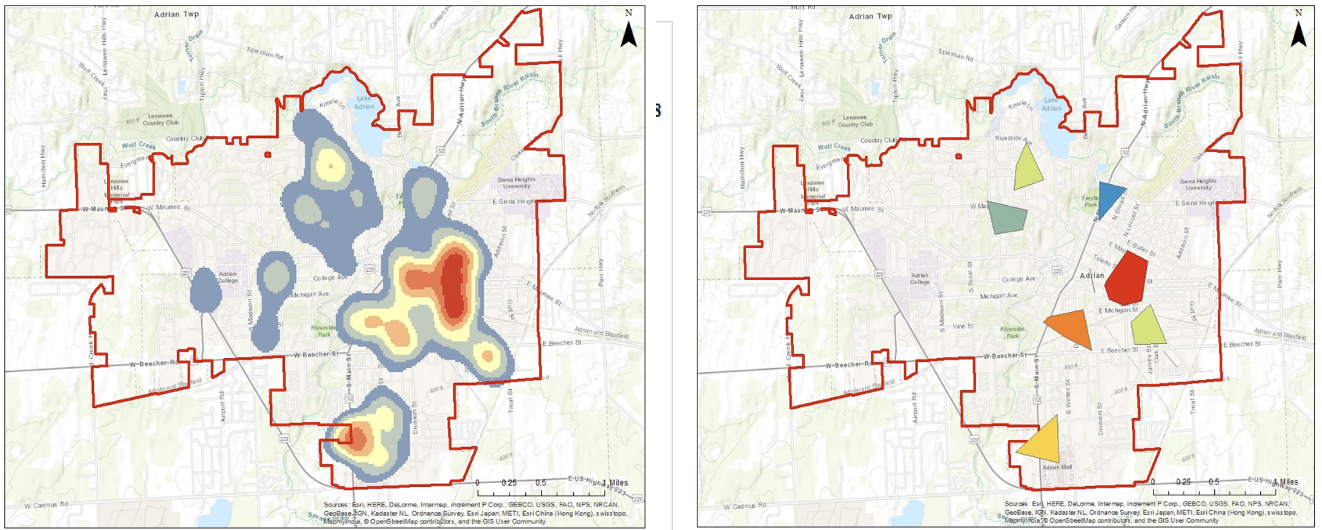
Phase 1. The research team identified crime patterns and focus areas for each city. First, a descriptive assessment was provided of violent and property crimes for each year of data collection (see Figure 3). Second, kernel density estimation (KDE) was applied to spatially evaluate crime patterns over time (see Figure 4). Third, the research team identified focus areas for each crime type and city utilizing the hierarchical nearest neighbor clustering (HNNC) approach. Focus areas represent areas within which violent or property crime has historically been a problem. The research team concentrated its recommendations for CPTED and placemaking interventions on these areas.
_and_distribution_of_property_crime_(right)_for.png)
_and_using_hierarchic.png)
Phase 2. The research team identified safe and unsafe areas within each city utilizing geographic and descriptive data obtained from the community survey (see Figure 5). These areas were geographically and descriptively compared to the focus areas identified for each city. To facilitate this assessment, the geographically identifiable information on locations participants perceived to be the most safe or unsafe in their neighborhoods were geocoded in ArcMap. The KDE approach was applied to facilitate a visual assessment of the areas within each city that are considered safe or unsafe. These areas were subsequently compared to the identified focus areas for each city, allowing geographic concordance to be evaluated between locations derived from participants’ perceptions of safety and the locations of crimes that had been reported to the police. To gain a deeper understanding of safe and unsafe areas, we identified themes across participants’ responses regarding why they considered a given location to be safe or unsafe.
_and_unsafe_places_(right)_overlapped_with_priorit.png)
Phase 3. The research team utilized data obtained from the community survey to identify patterns and provide descriptive assessments of participants’ characteristics and perceptions of neighborhood conditions. Factor analytic techniques were applied to condense survey items and capture underlying themes, such as social cohesion, informal social control, and physical disorder. Furthermore, the intersection nearest to participants’ homes was geocoded in ArcMap (version 10.8.1), providing a geographic context from which to consider responses.
Phase 4. The research team conducted a detailed evaluation of the focus areas within each city utilizing data obtained from the community survey, community workshops, and photovoice submissions. These data sources allowed for a contextually-rich understanding of each focus area. As part of this evaluation, the research team utilized on-site visits and Google Earth to explore the physical environment of each focus area. In accordance with CPTED principles, the research team recommended strategies to improve the physical environment of each focus area. These strategies were informed by ideas generated from the community workshops.
Step 7: Final Community Workshop
The final workshop engaged community leaders and residents in a facilitated “roundtable” dialogue to review and discuss the findings from the different exercises, co-create future policies and strategies to reduce crime, and increase placemaking in two categories: physical improvements and programmatic activities. The meeting began with an opportunity for shared learning. After the research team presented its findings on the crime data and perceptions, survey data, and built environment analysis, participants were led in an online dialogue to process the information together and identify commonalities or themes. The research team then engaged the steering committee members using Miro, an online collaborative communication platform primarily using a virtual sticky-note wall, in a brainstorming activity to apply the content knowledge they acquired from the researchers with their contextual knowledge of their communities to identify both physical (CPTED, placemaking, physical disorder) and programmatic (social cohesion, social disorder, formal social control) improvements to their city. The findings of these leadership roundtables and community surveys are further described below.
Findings
Quantitative Findings
As explained in the previous sections, survey participants were instructed to respond to six sets of questions that addressed their perceived levels of social cohesion, physical disorder, informal social control, social disorder, levels of surveillance, and placemaking activities. Since the focus of this article is not to delve into the details of our survey analysis, we want to briefly report that all six scales had a high level of internal consistency, as determined by Cronbach’s alpha values. Our correlational analysis showed a relationship between the six scales and the participants’ perception of how serious crime is in their area. The research team shared the details of these findings during the final workshop.
Photovoice Findings

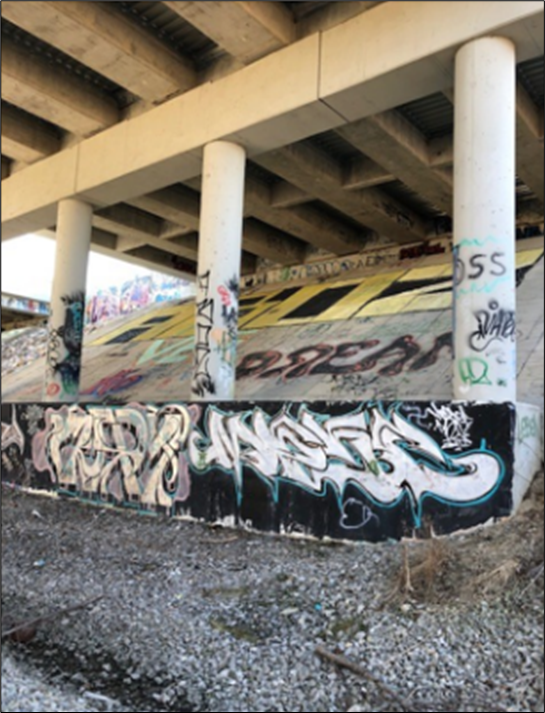
Since this activity occurred during the COVID-19 shelter-in-place phase in Michigan, this technique received the lowest engagement. The images representing gratitude showed upkept properties and parks, as well as improved access for pedestrians and cyclists. The images representing opportunity demonstrated the need to address homelessness, the need for maintaining roads, and the need to improve awareness in helping homeowners meet building and safety codes (see Figure 6). The analysis of the photos submitted through the Photovoice process also indicated that signs of territoriality are key concerns among residents. Although the number of submissions was low, every narrated photo aligned with the needs for physical and social improvements, showing the promise of this technique for use in this proposed participatory model.
Qualitative Findings
The research team shared the findings of the crime analysis, and the survey results before the community engagement meetings via the project’s website and Facebook page and directly to the steering committee. During the final community engagement meeting, the team reported each set of their findings to allow the participants to reflect and share their perspectives. The qualitative input received from all three communities showed that areas with high reported property and violent crimes were associated with physical disorder, low levels of surveillance, and low levels of territoriality. To some participants, the data offered further insights into their city. One participant commented: “I live in the neighborhood perceived as most safe. Sorry to hear that Mobile Home Parks are considered the most unsafe.” Another participant observed: “Perceived lack of safety seems to correspond with crime hotspots.” In communities like Adrian and Howell where improvements had taken place in areas marked as safe, the data confirmed that those improvements were working from a crime-prevention perspective. In one community, one participant said: “We are doing good as a city, but there are opportunities for improvement.” Similarly, in another community, one participant reaffirmed: “we should continue doing what we have been doing good and focus on other areas that haven’t had much success.”
The community’s input did align with the findings of the surveys where surveillance, physical disorder, social disorder, and placemaking all contributed to the perception of crime. When asked what next steps could be taken to improve conditions, the following generalized suggestions were offered across all three cities (see Tables 2 and 3). When we performed CPTED assessment across all the focus areas (all cities), and across all the street segments that respondents rated as safe or unsafe, our findings aligned with the recommendations proposed by the three communities.
Action plan and outcome
Using an open-coding approach, the research team identified key recommendations for city programs and modifications to the physical environment that emerged from the final, virtual engagement. These recommendations can be used to inform and advance city policies. Furthermore, the research team identified key strengths and weaknesses of their engagement with community stakeholders, which can be used to guide future virtual engagement efforts with communities.
In conclusion, we further recommend the following to successfully implement changes to neighborhoods or developments:
-
Developing a university partnership wherein crime data can be analyzed for the community is essential. Police departments, especially in smaller communities, often lack the resources needed to sufficiently analyze the data they collect to inform their practices.
-
For master plan updates, we recommend incorporating CPTED principles and recruiting a CPTED professional or collaborating with a university that offers such expertise.
-
For changes in neighborhoods, CPTED can only be successful through an engagement process with different stakeholders, residents, and decision-makers. The process we outline in this report is an effective way of co-creating crime prevention strategies with the communities.
In summary, actionable steps were determined by the stakeholders and the community. In following up with the communities post our study, Howell and Adrian reported that they updated their zoning ordinances, master plans, and capital improvement plans to incorporate CPTED strategies.
Assessment of Engagement Efforts
During each city’s public workshop, community stakeholders were asked to identify the strengths and weaknesses of the research team’s method of engagement. We summarize the findings as follows:
Second workshop
During the second public workshop, stakeholders were asked to rate the most meaningful activity and the least helpful activity from the following six activities that took place: 1) the visioning wall exercise with sticky notes at the beginning of the meeting; 2) the dot exercise of safe and crime hot spots at the beginning of the meeting; 3) the CPTED lecture; 4) the CPTED drawing exercise; 5) the Placemaking and Circulation lecture; and 6) the Placemaking and Circulation drawing exercise. For two of the cities, the most meaningful activities were the CPTED exercise (more than 45%), the placemaking and circulation lecture (more than 45%), and the placemaking and circulation exercise (more than 45%). For one city, the most meaningful activities were the CPTED lecture (63%), followed by the placemaking and circulation exercise (50%). The least helpful activity for the three communities was the wall exercise with sticky notes. In their open feedback, the participants have not learned what the results of that particular activity were. However, the research team shared these results with the stakeholders during the last public workshop.
The second part of the assessment asked the participants to rate the following on a five-point Likert scale: 1) the lecture that introduced the exercise helped me to understand the concept; 2) the lecture gave me the information needed to participate in the exercise; 3) I felt welcome to share my ideas throughout this exercise; 4) I felt listened to throughout this exercise; 5) this exercise changed my view of the issue in some way; and 6) this exercise was an important step in turning participants’ ideas into an action plan. For all three cities, more than 89% of the participants agreed that the lecture gave them the information needed to participate in the exercise, they felt welcome to share their ideas, they were listened to throughout the exercises, and that the exercise was an important step in turning participants’ ideas into an action plan. There was a mixed level of agreement on whether the exercise changed their views of the issue in some way (77%, 25%, and 25%). There was a consensus that the lecture introduced them to the exercise and helped them understand the concept (92%, 100%, and 78%).
Third and final workshop
Results of the surveys, the photovoice activity, and all the activities that took place in the second workshop were shared with the stakeholders during the final workshop. The brainstorming sessions were performed using the Zoom breakout feature and participants were instructed to provide their feedback using the MIRO platform. During the breakout session, stakeholders were asked to collectively give their feedback on what went well and how these workshops could be improved. Among the three cities, there was a consensus that sharing the crime data and the results of the questionnaires were the most helpful. Stakeholders also valued the opportunity to think together about the physical and social improvements they wished to see for their communities. There was also a consensus that they wished to see more citizens participating in the survey questionnaire that was available online. Stakeholders were willing to distribute the survey questionnaire even after the data collection period was closed.
Conclusions
Community-engaged participatory research is a popular approach used by planners in many cities to enact social change. However, few communities used these types of approaches to inform crime prevention strategies. Additionally, these methods were inconsistent across different studies. To address this need, the research team tested a community-engaged participatory research approach that combined crime data analysis, design, and engagement in developing the needed policies, tools, and strategies for crime prevention in three cities located in Michigan with populations of fewer than 20,000. We addressed gaps in the literature by employing a mixed-methods approach that leveraged evidence-based research on crime prevention strategies and can be replicated in smaller cities. We used criminology literature that stressed the importance of understanding the physical and social needs in an environment to address crime.
We learned that while there have been small and programmatic investments in high-crime areas, there have not been large, systemic investments in neighborhoods that can address historical disadvantage (e.g. lack of business organization and support infrastructure), lack of equity, and lack of organization that thwarts community organizing and revitalization efforts. In our research, we found that our innovation in the process is key. In communities where police funds are being reconsidered, there is an opportunity to engage the community in shared learning and ideation to develop recommendations that minimally require police engagement but that increase safety.
Working with the three different communities provided an opportunity to learn that context is important. One tenet of CPTED is engaging residents in the development of strategies because they have valuable context to share, which can impact both strategies and implementation. Communities that wish to systematically address crime through environmental design with ordinance language should consider their context when evaluating the appropriateness of other model languages. From our quantitative and qualitative assessments across the three communities, we learned the following. First, blighted properties lead to increased perception of crime, therefore, one way to reduce the increased perception of crime is to invest in blight removal activities. Second, public art and access to walking trails and parks decrease the perception of crime, therefore one way to reduce the perception of crime is to invest in these placemaking amenities. Third, residents were eager to learn about CPTED and placemaking principles and about how to improve their properties to reduce the possibility of crime. Fourth, when co-developing strategies in neighborhoods, participation must include a diverse and representative sample of the residents. Lastly, survey respondents who indicated they don’t feel comfortable walking in their neighborhoods suggest a poorer quality of life, which may lead to higher reported crime in their area.
Every study has limitations. Not surprisingly, one city that has low access to computers as per the U.S. Census had the lowest level of participation in this study. Therefore, paper surveys (our original strategy before COVID-19 restrictions) would have resulted in higher participation rates. Similarly, the number of submissions for our Photovoice exercise was also low during the pandemic. However, a major strength of our study was layering crime data with the perceptions of safe and unsafe places along with connecting the findings to CPTED assessments and qualitative data was most helpful in basing the discussions on evidence-based research. The other major strength is the number of engaging activities that allowed all voices to be heard and to be respected. Because these communities implemented policies as a result of the process, we believe that the process is valuable and might be a useful tool for both community development and restorative justice activities. Despite the challenges presented by COVID-19, we found that the original model, with its sequence of activities and mixed methods approach, provides a useful structure for unearthing latent ideas for community improvement around crime prevention, placemaking, and community revitalization.
Acknowledgment
We thank The Institute of Public Policy and Social Research at Michigan State University for funding this research
Declaration of Interest Statement
The authors declare that they have no known competing financial interests or personal relationships that could have appeared to influence the work reported in this paper.