Introduction
Analysis of policing practices in Minneapolis rarely incorporates both quantitative and qualitative perspectives on experiences of community members. In our work, we strive to understand these experiences using a combination of data analysis and qualitative engagement. We formed the Data / Justice Lab as a partnership between Confluence: An East Lake Studio Community Design, a Minneapolis-based studio dedicated to the holistic stewardship of the 9th Ward, and Carleton College, located in Northfield, Minnesota. Through our work, we utilize descriptive and spatial statistics methods to draw conclusions about the relationship between police use of force and neighborhood dynamics and characteristics in Minneapolis, Minnesota, specifically the neighborhoods within the Third Precinct patrol zone.
Our partnership originated from a conversation facilitated by the Center for Community and Civic Engagement at Carleton College in Fall 2022. Gould’s interests and impression of needs of the community matched well with an upcoming course offered by Kelling — a senior capstone in statistics. The project then continued through collaboration with Kelling, including occasional faculty-directed research projects over subsequent terms. On a long-term basis, Kelling was interested in partnering with community members to analyze publicly available public safety data. From the beginning of this partnership, dissemination was an essential topic of discussion, especially in initial formalization of a community partner agreement (Center for Community and Civic Engagement, 2025). Throughout the collaboration, beginning with our early meetings, we worked together to define exactly what the project needed to produce for both the community and the classroom. Before discussing the specific forms of dissemination for our partnership, we provide background information about the community in which our work is situated.
Community Context and Background
Our research centers the lived experience of Confluence Studio’s co-founders, Sam Gould and Duaba Unenra, their neighbors, and neighborhood histories by incorporating neighborhoods proximate to East Lake Street such as Powderhorn, Phillips, and Central in Minneapolis’ 9th Ward. The area has long been a site of arrival for many different communities for well over a century in regard to race, class, ethnicity, and sexual and political orientation. It is well known as a cultural hub and a site of mutual aid, cooperation, and political agitation towards “hegemonic” tendencies. It is also, for many of these reasons, a neighborhood with a long history of police surveillance and abuse, particularly towards Black, Brown, and Native neighbors. The very qualities that sustain the neighborhood are also the qualities that necessitate conversation about policing practices in the neighborhood.
Officers from what would now be categorized as the Third Precinct were in large part responsible for the founding of the American Indian Movement in the 1960-70s (Wittstock & Salinas, n.d.) due to their long and violent abuse of Native neighbors along Franklin Avenue on the neighborhood’s northern boundaries. And, as is well known, Third Precinct officers were responsible for the murder of George Floyd in 2020 which sparked potentially the largest social protest movement to date in United States history, bringing upwards of 26 million people to the streets in America during the height of the COVID pandemic (Buchanan et al., 2020). Between these two movements, there were numerous less visible but impactful negative interactions between police and community members. It is these less well-documented stories of neighbors, and their current lived experiences and questions, that drive our research and creative output. For our work it is essential that neighbors are catalysts for inquiry, not subjects that provide data to mine.
We use the terms “neighbor” and “community member” throughout our collaborative research and this paper. Everyone in South Minneapolis is a neighbor, but experience shows, and our analysis makes plain, not all neighbors experience systems of power — in the case of our inaugural research, we consider the power of the Minneapolis Police Department — equally. Inasmuch, while all voices are helpful in surfacing questions, it was and remains important for our research to prioritize either firsthand, or proximate experience to police use of force. This meant speaking with public defenders, harm reduction workers, BIPOC neighbors who live or work in the neighborhoods that are close in proximity to East Lake Street, and others who, due to geographic proximity, racial, or economic reasons are more likely to have first or closely proximate encounters with police use of force.
Many of our dissemination practices are grounded and supported in existing work on communication in quantitative community-engaged research. Through a feminist intersectional approach to secondary data analysis, Levac and Denis (2019) highlights the importance of reporting results in ways that are accessible to a variety of audiences, including non-statisticians. In our work thus far, we have focused heavily on visual tools, such as maps, and community dashboards which have been shown to effectively illustrate nuanced findings in a convenient and timely way to community members (El-Bassel et al., 2021; Wu et al., 2020). Approaches such as “integrated knowledge translation” and Community-Engaged Data Science have also emphasized the importance of involving community partners as contributors and decision-makers throughout the entire research process, including from question formation through dissemination (Olvera et al., 2024; Peirson et al., 2012). Dissemination of actionable insight is a critical and iterative process pursued in close collaboration between all members of our research group throughout our research, rather than as a final phase.
Dissemination
We begin our research and dissemination processes by responding to questions rooted in the lived experiences of neighbors in Minneapolis’ 9th Ward. The process is a kind of “call and response”: questions emerge from the community, analysis is conducted, and findings are brought back to neighbors to generate new questions and deeper reflection. Our research collaborative also focuses on making these findings accessible — translating them into neighborhood-friendly formats such as photographs displayed in public spaces, websites encouraging accessible interaction with data, posts shared via social media, and most importantly, gatherings centered on conversation and storytelling. We discuss many of these mechanisms below.
Our work thus far has focused on dissemination beyond traditional academic papers. Currently, we engage the academic community through public talks and workshops. We also plan to submit results from our research to peer-reviewed journals, adding to the evidence base on policing trends in Minneapolis. For example, we hope to analyze how trends in policing practices have evolved over the past 10 years — though the inconsistent nature of policing data in Minneapolis over time makes this challenging.
It is essential that we see each aspect of our work as contingent. Each separate aspect — a paper, an Instagram post, an assembly, an online platform — serves to strengthen the whole. The site of questioning at the neighborhood level — of oneself, neighbor-to-neighbor — is, and should be seen, as the work in and of itself. The contingent elements, discussed next, are tools in the aid of stewarding a site of grassroots questioning. All of these efforts, in this way, should be seen as an “expanded form of publication” and an effort to apply design thinking from community roots. This is accomplished by providing access to tools that allow neighbors to recognize and question the conditions they share and imagine the modes of relating and building that could develop in cooperation with one another. The mechanisms and projects we have used throughout our collaboration for participatory dissemination are described below.
Assembly
Assembly has played a vital role in the work of Confluence Studio and has served the work of the Data / Justice Lab as well. Confluence sees this role of gathering, with or without a set agenda, but with shared understanding of how one arrived in common through assemblies as an elemental aspect of publication and dissemination. For Confluence, publication is the deliberate attempt to form a public around a set of questions. By nature, these questions represent a divide. The work of analyzing the Minneapolis Police Department’s (MPD) use-of-force data began in assembly with neighbors helping to develop the most appropriate questions to ask. Our initial conversations with neighbors raised questions about the differences between how neighbors and Third Precinct officers viewed people as ‘suspicious’ — questions we explored by analyzing whether use-of-force incidents were initiated by a 911 call or not. After time and additional conversations, as well as structural changes to the MPD data, our questions evolved.
It is this “call and response” method of inquiry, in assembly with neighbors, that drives our process. In this manner neighbors are neither passive clients or research subjects but active creators and collaborators. Assembly acts as the foundational platform for our work, yet many expository mechanisms were necessary to sketch out a fuller picture of the lived experiences of neighbors. These assemblies have thus far been informal methods for discussion and dissemination of our work. We plan to formalize certain aspects of this work in the future, such as through interviews with neighbors about the questions, methods, results, and implications of our work. New research directions in these interviews could include discussions of neighbors’ priorities around understanding local policing practices, and translating those concerns into advocacy for feasible changes in MPD data collection and release practices.
As an example of how we incorporate assembly into our research, during the Harvest Assembly in October 2023, the research group discussed preliminary findings with community members involving spatial maps of use-of-force incidents that were initiated by a 911 call compared to those that were officer-initiated. We also presented a similar analysis but for those use-of-force incidents that were tagged as “suspicious person” as the problem in the use-of-force data. This analysis motivated many follow-up questions from community members in attendance, and it was clear from community members that there were more questions about this data than could be immediately answered from the research group. This directly motivated the development of public data analysis tools in Winter 2023, discussed in the following section, where community members can begin to explore their own curiosities and concerns about policing patterns through direct access and exploration of data.
Public Data Analysis Tools
Through our partnership, we collaboratively developed an interactive Shiny app[1] (a web application created using the R programming language) where the community can visualize policing data. This tool includes maps to visualize spatial trends in police use of force in the neighborhood. The data that is being displayed in these visuals can be filtered to answer questions posed by community members. For example, the data can be filtered to only certain time periods, sex and race of the civilian, time of day, types of force used (such as bodily force, firearm, handcuffs, taser, or chemical irritant), or ‘problems’ as coded by the MPD (such as suspicious vehicle, suspicious person, officer needs help, person in crisis, or person with a gun). After initial conversations with community members, we also added the ability to compare use of force in Ward 9 to other nearby wards. This would allow users to compare relative frequencies, as the ward maps include counts of how many records satisfy the criteria in or in close proximity to both neighborhoods as well as common plot legends. The goal of adding options for filtering the data is to encourage community members to ask their own questions and begin independently answering them. This reduces the delay of requesting analyses from research partners, allowing for a more fluid and community-driven dissemination process of analytical findings.
There were many important considerations that our research partnership encountered in the development of this tool. First, we needed to determine the form of spatial visualizations with community members. The spatial locations of use-of-force incidents that are released by the MPD are anonymized. Over the past few years, the coordinates of incidents have been coded as “CenterX” and “CenterY” or “CenterLongitude” and “CenterLatitude”, which likely indicate the center of either the block of the incident or a nearby block (City of Minneapolis, 2025). This anonymization process means that providing a map with only the coordinates of use-of-force incidents is not useful to community members as many points would overlap on the centers of city blocks.
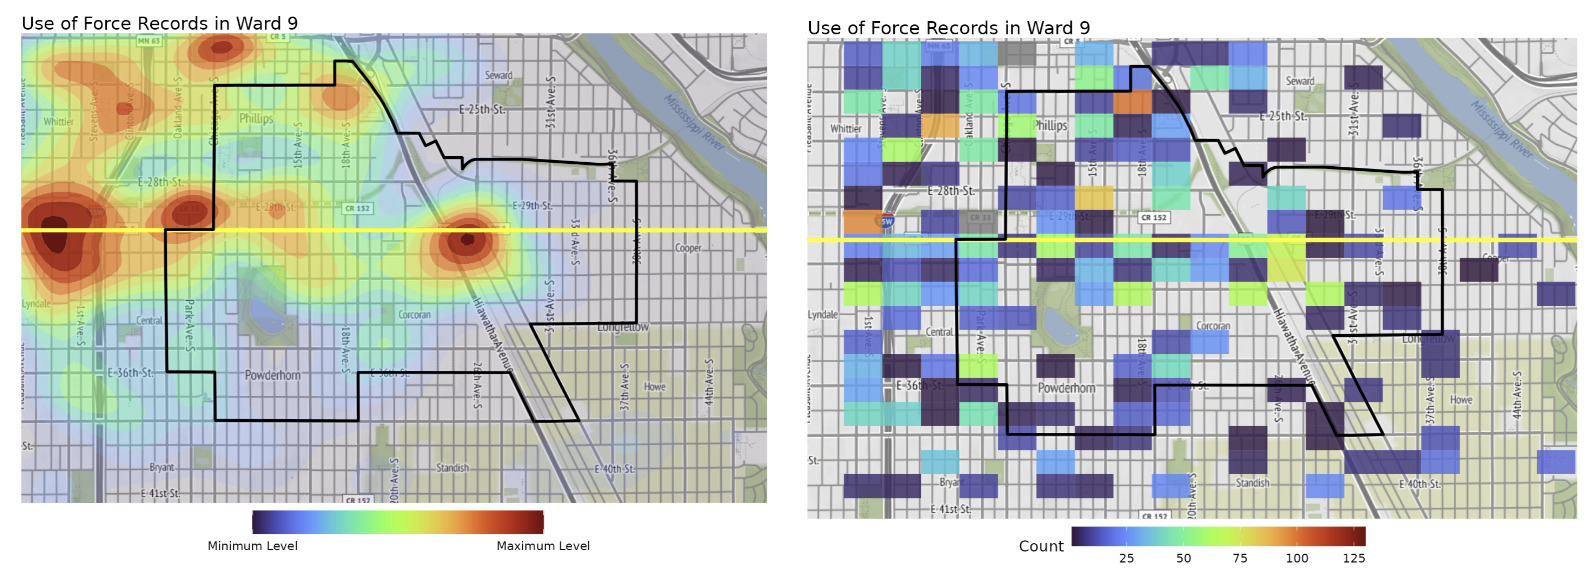
There are multiple choices to visualize patterns in spatial data beyond plotting coordinates. We consider two methods for spatial visualization on the website through kernel density estimation (KDE) and aggregation by grid units. We consider the first type of visualization because community members may already be more familiar with this kind of smoothly varying heat map. However, the legends of KDEs are not easily interpretable. We chose to label the two ends of the legend “minimum” and “maximum” and include the number of use-of-force incidents represented in the map above the plot in the app. However, as a result of conversation expressing desire for a visualization with a legend that community members could directly numerically interpret, we also included a map displaying counts of use-of-force incidents per spatial grid cell. An example of both of these types of images is included below in Figure 1.
_and_grid_count_(right)_maps_of_use-of-force_incidents_in_th.png)
We describe the additional pages available as of Spring 2026, which were developed to streamline access to information critical for community dialogue. In conversations with community members, we found that potential users of our tool wanted to know more information about recent use-of-force incidents in Minneapolis. In response, we created a dedicated page where users can explore the most recent week or month of incidents in the dataset in greater depth, rather than relying solely on the date filter and map on the main page. We display a map of these incidents and summaries of the breakdowns by force type, sex/race, and precinct. We note that although the MPD’s use-of-force data website states “The data set is refreshed on a daily basis by 9:30 AM” (City of Minneapolis, 2025), in practice there is typically a 2–3 week delay between the date of an incident and its appearance in the downloadable data. This was not the case when we began our research, but became the norm shortly after dissemination of the app, making our work to disseminate current conditions considerably more challenging. Other pages that we are developing for the app contain information on additional datasets of interest to community members, including other datasets on policing activity, demographic data from the American Community Survey and datasets from other sources beyond MPD.
Analysis of use-of-force data through our public data tools prompted the desire to make knowledge about ongoing police action in the community more accessible to the community, through projects such as the Blue Cloud.
Blue Cloud
In discussing our initial analyses on differing views of suspicion between neighbors and the MPD, neighborhood collaborators in assembly began to notice spatial clustering patterns. For those with local knowledge, these clusters were meaningful. Apart from concern over how numerous these use-of-force incidents were, the spatial patterns from year to year made sense to neighbors. Yearly analysis of spatial clusters correlated with inferred long-term patterns of activity that were geographically specific in places of concern to City officials and MPD.
These findings were the initial inspiration for the Blue Cloud, a project that utilized the public app, discussed in the previous section, to access information on recent use-of-force incidents and their locations. We note that at the time of this Blue Cloud initiative, data on use-of-force incidents released on the MPD-hosted website was only delayed by a few days. This made it possible to post timely information about recent interactions between neighbors and police. However, the current delay between the occurrence of use of force and the updates to the data available on the website means that disseminating information about recent use of force in a timely manner to the community is no longer possible. When the Blue Cloud was in operation though, it served as both a literal mapping project of use of force on a day-by-day basis, but also a conceptual metaphor of how violence moves.
The Blue Cloud operated as such: each day Confluence would track use-of-force incidents in the 9th Ward. Concurrent with these incidents, the Studio would post a photo taken in the neighborhood with blue smoke floating through the frame. A location, date, and time would also be associated with the photo. As well, to get neighbors familiar with this “blue cloud of violence,” the Studio distributed a series of posters so that this visual metaphor might become more known locally as a symbol for the roving force inflicted by MPD (Confluence Studio, n.d.).
Discussion
The mechanisms discussed above have proven to be effective ways of collaboratively analyzing policing in the 9th Ward of Minneapolis. We continue to discuss ways to intentionally engage community members in our ongoing research through iterative dissemination. In the near future, we hope to expand our data analysis beyond use-of-force datasets released by the MPD to include additional datasets and other sources of information that would provide a broader context to the public safety environment in Minneapolis.
Throughout our research process, we iteratively cycle through the phases of development of research questions, analysis, and dissemination, not necessarily in this order. For example, we have found that community engagement during the dissemination process often has us returning to the analysis process to more completely or clearly answer the same research question(s) after clarification of questions and initial findings. Visualization structures often go through several rounds of revision in order to clearly articulate the results of a specific analysis with community members. At other times, we develop completely new questions through conversations with neighbors about initial findings or after the development of new priorities. It is important to consider control over the decision-making process throughout all of these phases. Community members, through Confluence’s leadership, develop research questions that are then tailored to questions that can be answered using available data by the statistics team. Research questions are jointly approved before proceeding to analysis, during which the statistics team determines the most appropriate statistical methods. The Confluence team then drives decisions over how to disseminate results and channel findings into future analyses and community efforts. In our community partner agreement developed at the beginning of the project, we discussed regular meetings and checkins to ensure open dialogue, including about potential disagreements.
An important challenge during this kind of research is to be mindful of the potential unpredictability of the data being published. Throughout our research, the dataset has undergone both minor adjustments, such as variable renaming, and more substantial revisions, such as the removal of variables entirely. All of these changes, even small ones, could have important impacts on our research process that we have tried to anticipate. For example, small changes to the spelling of variable names means that our app would use a backed up version of the dataset, rather than the most recent version, if the current version of the data results in errors. The current use-of-force dataset published by MPD also no longer contains information about whether a use-of-force incident was initiated by a 911 call or an officer (Cooper, 2025). This information was an important component to our early research, and its deletion has fundamentally changed the questions we can answer with the current dataset. We have learned through this process that publicly disseminating information through visualizations/analyses that attempt to use current data need to be robust to changes in data and needs to be accompanied by an ongoing awareness and conversation about potential changes and their impact on community findings.
For others looking to complete similar analyses in partnership with community members, we have several suggested considerations. First, it is important to be mindful and intentional about the potential harms of visualizing and discussing police violence, such as retraumatization of community members. In our study, we emphasize how data visualization and artistic practice can play a role of drawing our own interpretations of data, as they serve as access points towards individual investigation and/or collaboration with neighbors. In this way, these mechanisms can work towards both collective healing and empowerment of communities to advocate for change. It is also important, whenever possible, to locate detailed data documentation as datasets from different cities often only include a limited scope of force types and define force differently, which can impact interpretation of the analysis, especially when comparing cities. We also note that we are looking to expand the reach of our participatory dissemination methods in the future, through exciting new community-led efforts. Transmission will be a storefront and a creative and critical social lab for Confluence’s work which will, as well, support the work of the Data / Justice Lab. With a programming / gallery space, bookstore, printshop, and cafe, Transmission will be a space for neighbors to meet, surface important questions based on lived experience, and collaboratively find means to both research and make visible our findings. Future researchers should carefully consider who is included in their participatory efforts that drive analytical development, and when/how they are included through frameworks such as “choice points” (Vaughn & Jacquez, 2020). Existing work has also proposed methodological guidelines, such as Community-Engaged Data Science, data judo, and others, that could provide effective tools to researchers looking to take part in quantitative participatory analysis (Morello-Frosch et al., 2005; Morton & Kelling, 2026; Olvera et al., 2024). Finally, the analysis of bias in policing is a statistically complex issue, and care must be taken to conduct accurate analyses that account for the realities of policing, such as uneventful shifts or the distribution for calls for service (Knox, 2021; Ratcliffe & Hyland, 2025).
This work is not a finished product but a living collaboration, one that will continue to evolve alongside the needs and priorities of neighbors in the 9th Ward of Minneapolis. We hope this collaboration demonstrates the promise of quantitative research that is driven by and accountable to the communities it seeks to serve.
Acknowledgements
This material is based upon work supported by the National Science Foundation under Grant No. 2316857. We also acknowledge the student researchers that have been crucial to the creation of the Shiny app discussed in this paper and the staff at the Center for Community and Civic Engagement at Carleton College for their support throughout this project.
The description of this app is accurate as of Spring 2026. This app adapts to the ongoing needs and interests of community members, balanced with the availability of the students and faculty who build and maintain it, and may look different by the time of this reading.