

Recently, former University of North Carolina Chancellor and Editor-in-Chief of Science, Holden Thorp (2025), stated: “We need to treat the communication of science as carefully as we treat the science itself - because it IS the science.” Moreover, that communication, or dissemination, needs to not only reach and speak to other scientists; it also must reach and speak to those who can make change – action is the center of research (Robert Wood Johnson Foundation, 2025). To make change, researchers are called to authentically engage with those closest to the issue under study who can guide and co-create meaningful policy and practice solutions to share with key audiences (Bell, 1995). Dissemination of research findings that advances equity can take many forms, moving beyond peer-reviewed journal articles, which have a place when considered carefully (Flicker & Nixon, 2016). Equitable and participatory methods of dissemination of findings can include policy or research briefs, blogposts, podcasts, social media townhalls (e.g. Bluesky), webinars, infographics, and data walks, the method we will focus on in this article. Data walks are community gatherings where research findings are displayed in an engaging, interactive poster format, designed to be accessible and digestible for lay audiences (Murray et al., 2015; Sperling et al., 2025).
Here, we seek to describe how this equitable dissemination method is used across two research-practice partnerships (RPPs) in collaboration with community partners who work together to determine what and how data should be presented and to whom. We present three case studies from these RPPs that highlight this equitable method of research dissemination. The first two case studies present processes used with two early childhood sites in the Educare Network (Frank Porter Graham Child Development Institute, 2025; Yazejian et al., 2013). One site is in a mid-sized mid-western capital city, and the other program comprises multiple sites, including one on an American Indian reservation. The third case study describes a process carried out by another member of the Network with data from a different research study, highlighting 1) what the co-author learned from her Educare colleagues and incorporated into the data walk and 2) that data walks are discipline agnostic and can be used in a wide variety of fields.
Setting the Context
Two of the case studies highlighted here draw from schools in the Educare Network, a national network of early childhood schools that also includes a network of scholars who conduct research with and evaluate the Educare early childhood program model with sites across the U.S. (FPG, 2025; Yazejian et al., 2013). Each site has a Local Evaluation Partner (LEP) team that partners with the early childhood school to collect and share data for program evaluation and continuous improvement. The network promotes equitable research practices that are inclusive of program leadership, staff, and families and center community engagement, including in the dissemination of data. Over the past 5 years, the research network, led by the National Evaluation Partner at the University of North Carolina at Chapel Hill, has been intentional about creating workshops and other trainings to build skills for anti-oppressive research practices via a monthly community of practice, seeing a significant uptick in the number of anti-racism practices used (De Marco et al., 2024). We each selected data walks for our projects’ dissemination and meaning-making sessions given their participatory nature and the data shared can be considered a “rough draft.” That is, the information is presented as a jumping off point for joint discussion that can lead to additional strategies for analyzing the data and/or corrections to analytic methods, as well as brainstorming ideas for action, changes to policies and programs, and suggestions for future research.
Theoretical Framework
Taking Critical Race Theory (Bell, 1995) and participatory action research (PAR; Feekery, 2024) as guiding research frameworks, we are called to engage those closest to the study topic in all facets of the research process: the design, selection of methods, analysis of the data, interpretation, presentation of the findings, and recommendations. This mandate includes providing ways for key community members to review and help make sense of data. Likewise, we are required to take appropriate action based on those findings to ameliorate the injustices uncovered (Bell, 1995; Daftary, 2018).
Moreover, to advance racial justice we must also advance the diffusion of participatory approaches to the use of research findings (Kirkland, 2019). Participatory action research (PAR) is an established method for collaboratively examining change as it offers a reflective, flexible, and practice-focused way for promoting change and reflecting on research-informed outcomes (Feekery, 2024). Feekery describes PAR as collaborative, critically reflective, change focused, and conversation driven. Participatory action research is by definition collaborative as it combines the expertise of research scientists and community members with lived expertise. Further, as Feekery captures so starkly, “The research needs to enhance the experiences or situations of those working within the research context, rather than merely enhancing the career of the academic researcher (p. 334).”
“Participatory” research falls along a continuum of community involvement from quite low-level involvement, inform, to quite high-level, empower (Jacquez & Vaughn, 2025). At the inform level, the research team informs the community about the study, and the community receives information, for example through newsletters or public meetings. At the other end of the continuum, empower; the community leads the research process and is the ultimate decision-maker. Example methods include action teams, leadership development, and delegated responsibility.
Our Research-Practice Partnership (RPP) work flows from authentic community engagement in a participatory action research (PAR) framework, one of the key tenets of anti-racism research, in which research questions address the disparities that may arise from policies, practices, and conditions, rather than focusing on the limitations of the people experiencing those disparities (Kendi, 2019). RPPs are one way of engaging in equity-minded research. One of the guiding principles of RPPs is to actively work to shift power relations in research so that all participants have a voice (Arce-Trigatti et al., 2024). Through the RPPs described below, collaborative teams comprising community partners and researchers worked together to identify research questions that would support continuous quality educational improvement and/or equitable transformation—another key tenet of RPPs (see Table 1).
Article Purpose
In the following sections, we present the cases from two different Educare LEP Teams to highlight how they have used data walks to engage community members in meaning-making sessions with research findings in interactive and visually interesting ways. In addition, we present a third case study demonstrating how the methods used by the LEP Teams were adapted for another, very different, research study by a member of the National Evaluation Partner. The aim of presenting these three case studies is to show how the collaborative sharing of research results can be a model of equitable partnership between scholars, program leaders, families, and community members in a participatory framework. The 7Cs of PAR from Feekery (2024) are noted in each to highlight those practices.
Case Study 1. Educare Lincoln
Unique Highlights
-
A culturally and linguistically diverse program
-
The Family Engagement Specialist (FES) team collaborates to provide interpreters for different languages, as needed.
-
Data walk goals are to co-create shared understandings, celebrate achievements, and brainstorm potential solutions to specific challenges.
-
Learned that families more likely to share ideas at the data walk than to complete a survey
Context and Background
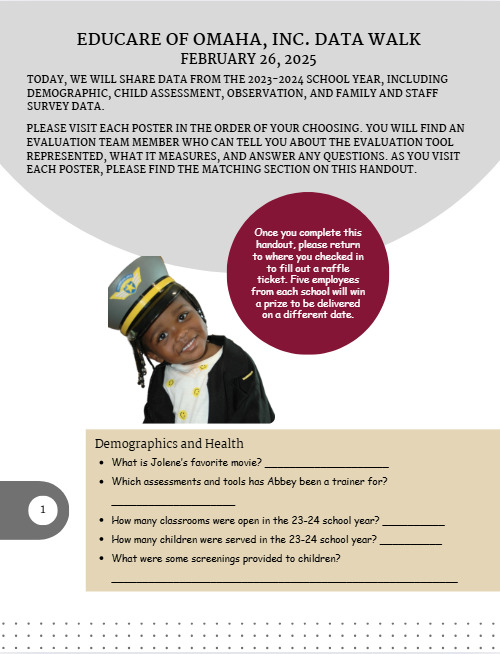
Educare Lincoln is among the most culturally and linguistically diverse of the Educare network with more than 50% of children coming from homes where a language other than English is spoken. The LEP Team at Educare Lincoln began hosting data walks during the 2023–2024 school year at the suggestion of the fourth author, who at the time was the family engagement specialist (FES) supervisor. Given her work in helping the LEP Team collect interview and survey data from Educare Lincoln families, the fourth author realized the need to create a dialogue around the school’s program evaluation findings and to share ownership of the data with the families and staff from whom it was collected. Additionally, our LEP team was seeking ways to build stronger ties with Educare Lincoln families and staff. As such, data walks have become an essential component of the RPP between the LEP team and the Educare Lincoln community despite having only started this practice in recent years.
Implementation and Approach to Data Walks
At Educare Lincoln, data walks are hosted annually (cyclical) in the spring of the school year. They often involve various data visualizations to foster discussion about programmatic trends and patterns, celebrate achievements, identify challenges or areas of need, and brainstorm solutions for continuous improvement among the school community (e.g., families, staff, administrators, researchers; change-focused). One key advantage of data walks is that they have provided families and staff with a more accessible way to engage with program evaluation findings when compared to traditional methods like written reports. Importantly, including the data walks as a part of Educare Lincoln’s organizational routines has allowed us to build relationships with families and staff. In the following section, we describe practices for selecting the content to present, planning and organizing the event, and engaging with families and staff around the data.
Selecting and Planning the Content
Identifying the content and data points to highlight is a critical step in organizing a data walk. Given the LEP team’s role in collecting the data, they often initiate identifying topics of potential interest to families and staff. We start by compiling and reviewing the available data (e.g., survey data, demographic data, assessment data) to identify interesting and pertinent information that is linked to priority issues and will encourage discussion among attendees at the event. Subsequently, the LEP team consults with teaching and family engagement staff and Educare Ambassadors—a parent advocacy group—to obtain feedback on recommendations and address concerns (change-focused). Table 2 shows examples of topics that have been covered in data walks across all three case studies.
Once a set of topics is finalized, the LEP team analyzes the data and prepares large posters that feature data points in both text and graphic forms. The goal is to present information in ways that are digestible and readily understandable to a wide audience. Moreover, we work to create a balanced story with the data by highlighting both strengths and areas for improvement. To this end, preparing the posters is often an iterative process in which the team discusses the layout of each poster and determines the appropriate charts, tables, and graphs to display key trends and patterns (conversation-driven). The team also plans for discussion and engagement by including reflection questions on the posters to encourage dialogue among attendees at the event. Finally, the LEP team reviews the text on the posters to simplify overly technical jargon and ensure that the language is accessible to varied reading levels.
Planning the Logistics
Planning the logistics of a data walk is also a collaborative effort between the LEP Team and school staff. We typically plan for two data walks each spring, one for families and one for teachers. Both data walks are hosted at Educare Lincoln as it is a location that is readily accessible and convenient for the target audiences. The LEP team starts by meeting regularly with school staff to outline a plan that considers several key elements, including time, format, supports, and incentives. In this section, we discuss how these elements may vary depending on our target audience, supports, and incentives.
The data walk for families is generally flexible in its timing and format. An important logistical consideration is determining the time when families are most likely available and willing to attend (context-specific). Through trial and error, the team has found that hosting a data walk during pick-up time (2–5 PM) is the most opportune time for our families as it affords certain advantages. First, family members are already present in the building, making it easier to invite them to take part in the event. Second, childcare is more easily available as families can choose to have their child stay in the classroom with their teacher while they attend the data walk. In cases where families bring their child to the event, the LEP Team and school staff often work together to attend to children while parents review the posters and participate in discussions without interruptions. In terms of format, the posters are set up in a large room and spread out so that attendees can visit each poster individually or with a small group. At least one member from the LEP Team stands by each poster to provide a summary of the data, address questions, and foster discussions about the information presented. With no fixed schedule for the event, families can come and go as they please. Overall, this approach has shown to be the most beneficial as it creates a low-pressure context for families and allows them to decide the extent to which they want to engage with the data.
In contrast, the data walk for teachers is generally more structured as it occurs during a professional development day for school staff. The LEP Team typically plans for a two-hour window during which the teaching staff is divided into small groups that rotate to each poster and engage in discussions about the data. Given the fixed time slot, the small groups generally spend 10 to 15 minutes at each poster. At the start of each rotation, members from the LEP team provide a summary of the data, highlighting trends and patterns, before soliciting questions and comments from the attendees.
Engaging in Discussions About the Data
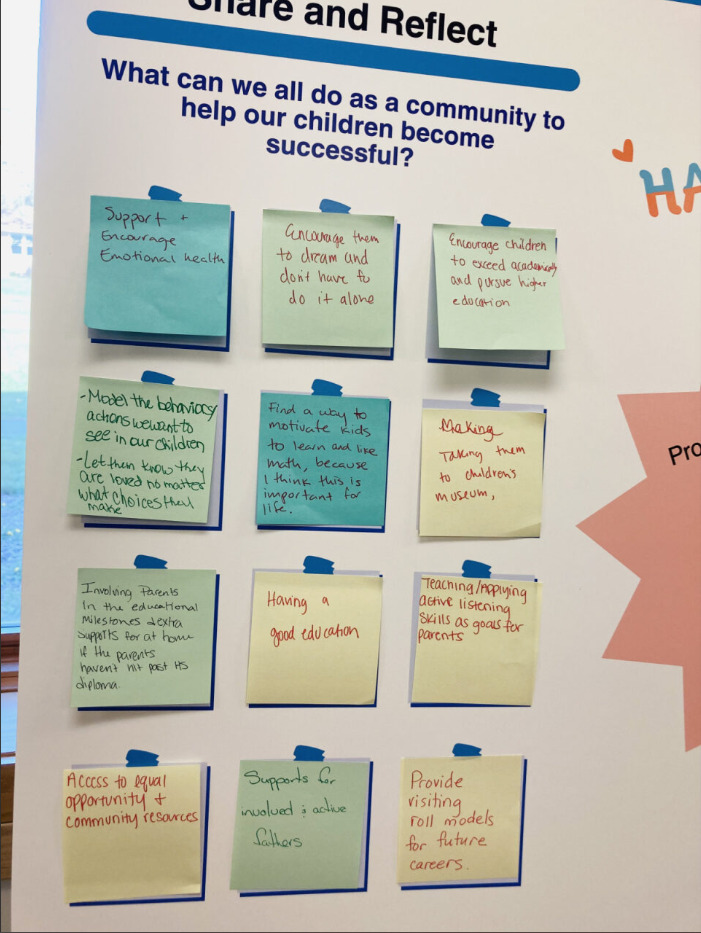
The LEP team uses various strategies to foster discussions and engagement at the data walks. Educare Lincoln serves a large proportion of families from linguistically diverse backgrounds with caregivers who often have varying levels of English proficiency. Thus, to ensure that families can fully participate in discussions, we collaborate with the FES team to provide interpreters for different languages as needed. Importantly, attendees are encouraged to make meaningful connections with the data based on their personal experiences, which helps the LEP Team to contextualize the findings (critically reflective). In doing so, facilitators may pose the discussion questions included on the posters and invite attendees to share their thoughts and wonderings either verbally or in writing as shown in Figure 1. Ultimately, the goal is to offer opportunities to co-create shared understandings, celebrate achievements, and brainstorm potential solutions to specific challenges.

Impact and Lessons Learned
Data walks have strengthened the RPP between the LEP team and the Educare Lincoln community in two ways. First, they have provided an avenue for connecting with families and staff. Data provides a shared foundation for the context of the school community and helps to determine next steps for meeting goals. For example, a discussion question for one poster asked: “What supports would help our families overcome barriers/challenges?” Written responses from families included:
-
“Making sure families understand Educare can connect families to resources in communities.”
-
“More info on education programs for parents.”
-
“Staff training in trauma informed care and cultural training.”
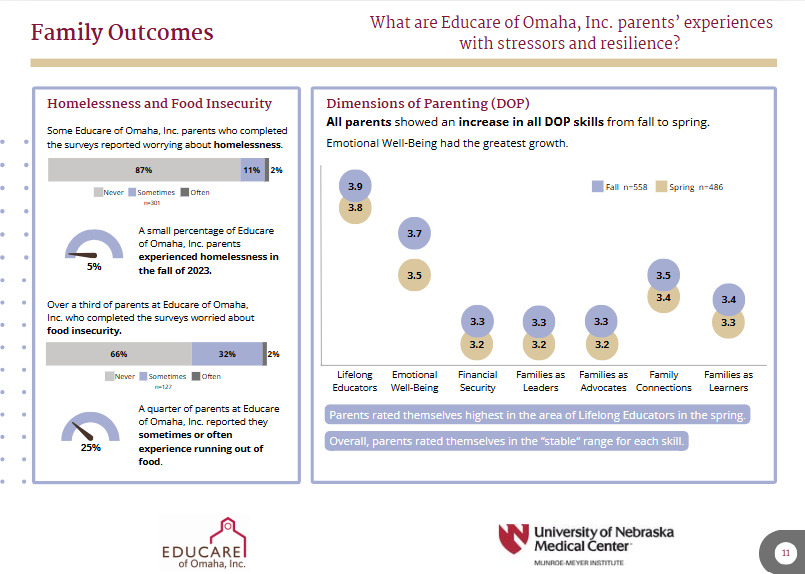
In response to this feedback, Educare Lincoln has strived to better connect families to community resources by inviting community partners to family engagement events. The LEP and FES Teams have also collaborated on multiple family engagement events to help inform families about various ways they can support their children’s learning at home. In a more practical sense, data walks have served as a venue for families to meet the LEP Team, build trust and community, and understand the ways in which the school is using the data to improve children’s education. Second, data walks have helped the LEP team collect feedback and to contextualize the data. Feedback from families is critical for considering how data are collected. For instance, one participant shared that they did not feel some of the findings were accurate: “Food and homeless graph I feel is not accurate. Maybe find a way to have families answer in an honest way.” Such insights help when considering how data are collected, the ways questions are phrased, and how we might support families and staff in feeling more comfortable sharing their experiences.
Two types of feedback are collected at data walks: a survey on the event (e.g., opinions on the amount of data shared) and feedback on the data. Overall, families are much more likely to share their ideas about the data than to complete the feedback survey. Further, we found that families are not likely to respond to online feedback surveys. Although 41 adult family members attended the most recent data walk, only three completed the feedback survey via a QR code posted in the room. In contrast, when feedback posters were used with three brief questions (e.g., “How much did you enjoy the data walk event?”) and stickers were provided for participants to respond; more families responded.
There are also logistical considerations for planning a successful data walk. As previously discussed, identifying the “right” timing for the target audience can help to yield a higher turnout. Thus, it may be beneficial to survey or obtain input from potential attendees to determine a time that works best with their schedules and availability. In addition, the ways in which the data walk is publicized and promoted may matter for turnout. In the case of Educare Lincoln, families were much more likely to attend if they were directly invited by a staff member that they knew. Notably, food incentives also yielded greater turnout and participation from families. However, parents were likely to pick their children up from their classrooms and bring them to get food. This sometimes presented a barrier for families to engage with the data as they were focused on attending to their children.
Case Study 2. Presenting Early Childhood Data Across Multiple Educare Sites
Unique Highlights
-
Key equitable practice tenet is to increase and improve understanding of data and data utilization across all organization levels
-
Essential to data walk success is the collaboration between the program staff and the LEP research team
-
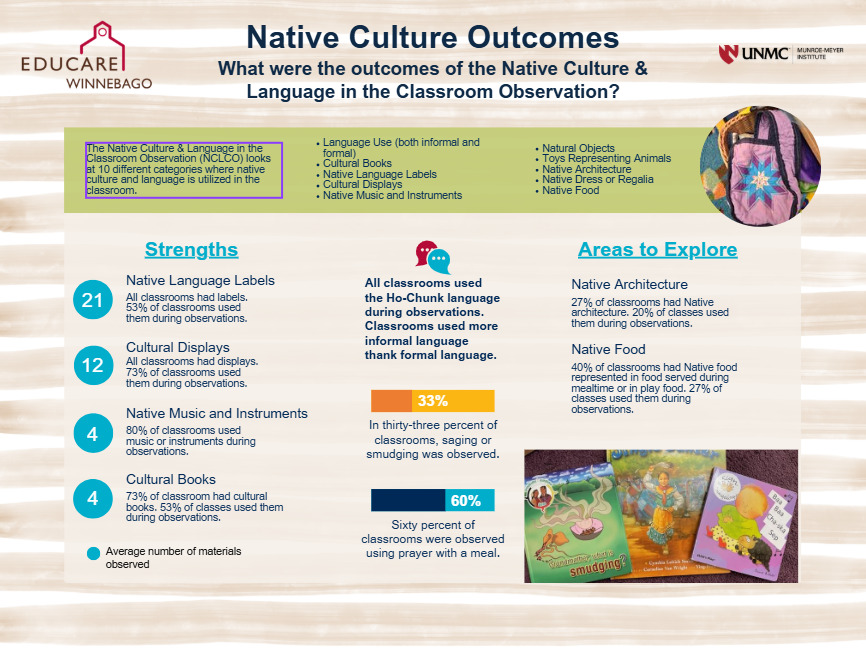
For the Native American-serving site, data on classroom cultural practices and outcome data on students’ acquisition of the Ho-Chunk language were cornerstones of their data walk (see Figure 3).
-
Encouraging participants to provide written reflections was effective in actively engaging staff with the data
Context and Background
The University of Nebraska Medical Center (UNMC) LEP team serves six early childhood centers, each with unique demographics and neighborhood contexts; yet most of the data collected are the same across sites. As the long-term evaluation partner for all sites, one of the long-standing tenets is to increase and improve both understanding of data and data utilization across all levels of an organization (collaborative, change-focused). One way to accomplish this goal has been to incorporate data walks on an annual basis. These data walks, developed in collaboration with the program team, are an opportunity to not only review the data but to inform and to receive input from community partners and parents about both the successes and challenges of the past year. Moreover, data walks are one of the data dissemination tools used to connect with site-level stakeholders. Our challenge has been in finding ways to make the data usable and understandable for staff, parents, and community members across each of the six distinct sites. To illustrate, one site serves nearly 100% Native American students, one site serves primarily Black students, one site serves a majority of students identifying as Hispanic, and the other three sites are a mixture of races and ethnicities.
Implementation and Approach to Data Walks
The LEP team started conducting data walks several years ago to connect the data back to the classrooms and instructional practices. The LEP team and program team noticed that classroom educators needed additional opportunities to understand and utilize data to make improvements and/or inform practice. The data walks allowed educators the opportunity to dive into the data, ask questions about their site, and review the assessment tools used by the LEP team. Reflection questions encouraged them to consider why differences were being noted in scores and how they could use the data to make changes in their classrooms (change-focused). As staff from all sites attend the data walks, it also allows them to have conversations about the data and to informally network across sites. See Table 2 for an overview of the data shared.
Selecting and Planning the Content.
Data walks were started with the Omaha sites and based on the success and feedback from those, the team began to utilize them at the Winnebago site. Several methods have been incorporated over the years as both the site level culture and the data walk structure evolved. The key to success for the data walks has been the collaboration between the program staff and the LEP team. Data walks are a collaborative effort between both partners and require a level of trust and strong relationships. The data and the messages presented are agreed upon by both partners – the LEP would not present data publicly without permission and input from the program team. Once the posters are developed, the program team reviews them for understanding, branding, and messaging.
Engaging in Discussions About the Data
Data walks are not the first time the team has seen and/or discussed the data. Given that each site’s goals may be different, data selected for the data walk is often specific to those goals. For example, one site was interested in the results of lead screening in their catchment area (collaborative). While the number was not huge, enough children were impacted that it was noticed by one of the funders attending the walk and staff made comments such as, “For even one student to have lead poisoning is too much.” It is likely that without the data walk, that small piece of information would not have been noticed in an 80-page evaluation report. Inclusion of cultural observations and data that are not required by the national evaluation but are important to the site is another component to hosting an interactive data walk. For the site serving mainly Native American families, information on the cultural practices in the classroom, results from a family cultural survey, and outcome data on students’ acquisition of the Ho-Chunk language were cornerstone pieces of their data walk (context-specific).
A key to a successful data walk is finding ways to share more manageable/digestible data. Our posters have become simpler and are not posters typically presented at an academic conference. Rather, they have a couple of key points about the data and one to two figures with the data displayed. Also, we make sure the print and graphics are large enough for participants to read from several feet away. See Figure 2 for an example poster. After each data walk, the team debriefs on which pieces of data resonated with the educators and others in attendance.


Encouraging participants to provide written reflections has been an effective way to have staff actively engaged with the data during the data walk. The LEP team developed forms asking questions about the data that staff can access from either the posters or from asking questions to a member of the LEP team hosting the poster (see Figure 4). The reflection sheet aligns with the posters so that staff can easily take notes and reflect on the data. For five of the sites, participating in the data walk and completing a written reflection form has resulted in earning a Continuing Education Credit (CEU). The LEP team also provided a set number of small prizes (e.g., a plant, gift card, candy) for completing the data scavenger hunt. Staff responded well to the possibility of winning something. Since prizes were given to each site and were randomly selected from the sheets turned in, it made it fair for everyone regardless of if they attended the data walk at the beginning or the end of the set time.
Over the years, we have tried different types of groupings for participation in the walks: self-paced versus rotating groups. Each of these methods has pros and cons. Self-paced allows participants to hone in and focus on data and conversations they are most interested in. However, they might miss the discussions and questions that occur in timed rotating groups. Groups tend to be dominated by those most interested in the data and may not allow those less familiar with data to ask questions and/or wonder about how to use the information to impact student development. Interestingly, for the site on the American Indian reservation, the rotating groups has worked the best while at the other site self-paced has been viewed more positively. Some of that is due to the expectations of leadership at the sites. For the rotating groups, the expectation is to rotate with their pod/teaching team to have richer data discussions (conversation-focused). For the other sites, the data walk is one part of work expectations for the day, as many are also needing to complete home visits during that afternoon. Self-paced allows for the flexibility to attend at a time convenient for them.
Providing food has been an inviting way to encourage socializing and networking while reviewing the data. One site does food potluck style while the other caters in snacks and drinks. Both ways have been effective in encouraging attendance and engagement. The catered option allows for more attendance of parents and community partners, but the potluck style tends to encourage more informal conversations and interactions.
Adding activities related to the poster topic(s) has also been successful. Examples include an online quiz, brainteasers, and games related to child assessments, a game show concept with questions related to observation tools, and questionnaires about one’s personal traditions to relate to family survey data. Participants noted that these activities helped them better engage and connect with the data (critically reflective). Participants have several options for providing feedback on the data walk including survey completion, written comments on their data sheets, and providing direct feedback to LEP team members. In addition, the LEP team debriefs the data walk with the program management team. Comments from staff on the presentation and interactive nature of the data and how they planned to use the data included:
-
“It was smaller groups, and we had more opportunities to talk to the people about the data and what it represented”
-
“Very interactive”
-
“Interactive games made it easier to stay engaged”
-
“Tweak lesson plans and make sure kids are getting individualized lessons”
-
“Teach more Ho-Chunk language[1] and find more Native materials for areas”
-
“Work on my quality of feedback and activities for ITERS [Infant/Toddler Environment Rating Scale]. I’d also like to score well on the safety procedures section on ITERS.”
Impacts and Lessons Learned
Data presented in the data walk has led to additional conversations around health indicators, cultural practices in classrooms, and parents wanting to learn more Ho-Chunk as they recognize their children learning the native language. At one site, information presented on parental depression helped support the addition of mental health support to be provided on site. At another site, the data led to an increased focus on how to serve families experiencing homelessness. Finally, the data presented encouraged one Nebraska Department of Education employee to wonder if State Board members could attend to see the impact of a high-quality early childhood program on language, executive function, and social-emotional skills.
Case Study 3. Extending the Practice: Structural Racism, Affordable Housing, and Homelessness
Unique Highlights
-
Setting was research on homelessness that required leadership from community-based and academic investigators on a project emerging from the community.
-
Thoughtfully designed to create an equitable event that authentically engaged a wide variety of community members while being mindful of power dynamics
-
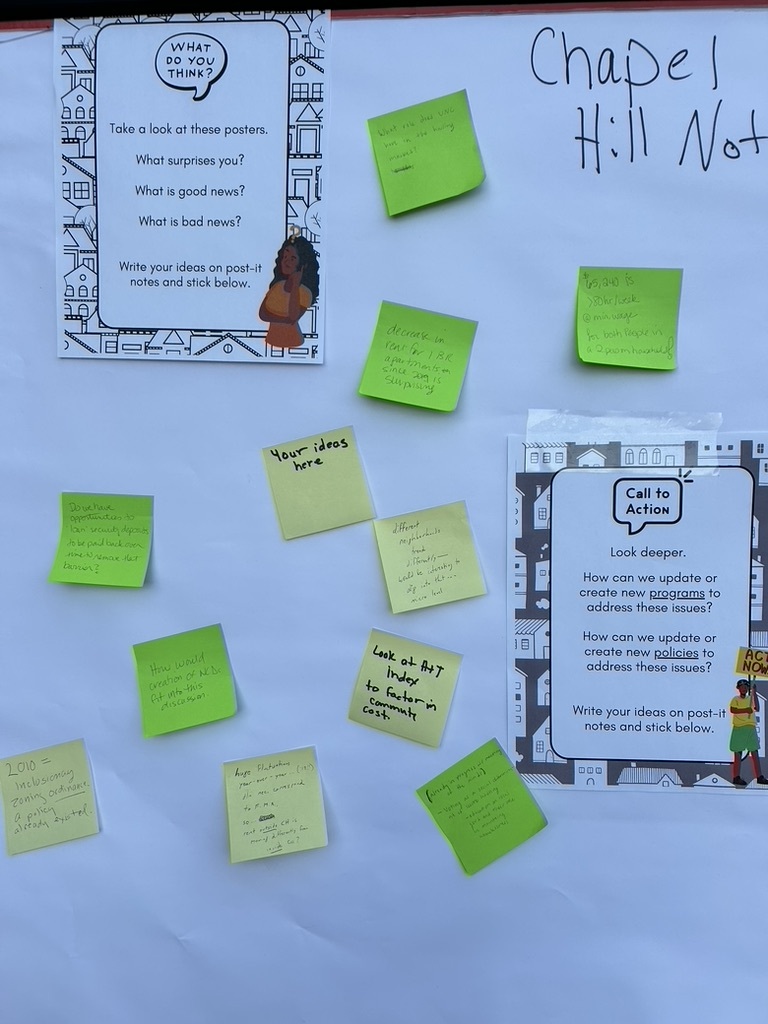
Questions for reflection and action included: “How can we update programs to address these issues?” and “What is one idea you have for policy change, program change, or an action you can take to advance equity?”
Context and Background
The third case study describes a data walk conducted for a project on structural racism and affordable housing that built on what the first author learned from colleagues’ data walk dissemination work presented in the first two case studies. This case study demonstrates that dissemination of findings via data walks is discipline agnostic, such that these events can be used with a wide variety of research topics and audiences.
The affordable housing case study highlights a data walk used to share back findings from a collaborative study that was part of the Robert Wood Johnson Foundation’s (RWJF) Interdisciplinary Research Leadership program (IRL), which requires leadership from both community-based and academic principal investigators with a project that emerges from the community. This project was initiated by the Community Empowerment Fund (CEF) in Chapel Hill and Durham, NC, which provides support to community members at risk of and experiencing homelessness. Using an innovative RPP collaboration, we investigated the relationships among structural racism, housing stability, and well-being. While there were several data collection efforts, the data walk presented findings on experiences of housing insecure individuals and trends in housing prices in the two study communities. Study participants were asked to respond to questions including: “What has finding housing meant for you?” and “What made it hard to find housing?” These responses were summarized and illustrative quotes were added to posters to engage data walk participants (see details about the data presented in posters in Table 2).
Implementation and Approach to Data Walks
The design of this data walk was guided by the Educare Network’s Research Agenda: Advancing Racial Equity (2023), particularly principle 7, actively and meaningfully involve the community, and principle 11, leverage channels and mechanisms for communicating and disseminating research findings in ways that are accessible. Prior to designing this data walk, we consulted with our Educare colleagues who designed the events described in the first and second case study to learn how to create equitable events that addressed authentically engaging a wide variety of community members while being mindful of power dynamics.
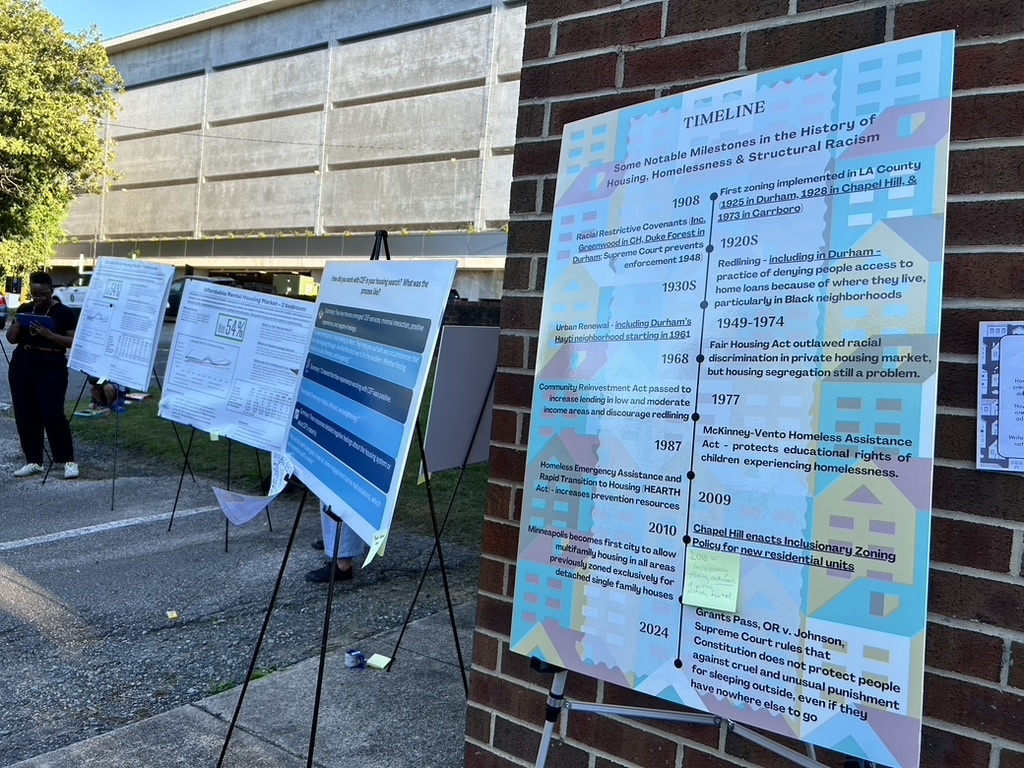
The data were gathered as part of a mixed methods study that used quantitative data to examine changes in housing prices over time in the two study communities and qualitative data to understand the experiences of those facing homelessness as they searched for safe, affordable housing, including interactions with the community partner. Thus, there were a series of posters for each type of data. In our experience, the sharing of qualitative data is less common in data walks, so we worked to convey the richness of community members’ words while making the posters engaging visually and not overwhelm the viewer with the amount of text on each poster. Because Critical Race Theory encourages the placement of social problems within their social, political, and historical context (Daftary, 2018) and Participatory Action Research advocates that research be context specific (Feekery, 2024), we created an additional timeline-style poster that depicted key events related to housing and structural racism in our study communities (e.g. redlining and urban renewal in Durham, NC; Eaves, 2025). See Figure 5 for the placement of this poster in the data walk sequence.
Planning the Logistics
We held one data walk in each study community to which all participants and community partners were invited. Thus, we opted to schedule the events in the early evening to accommodate work hours and hold them as drop-in sessions in which attendees could join as they were able and take a self-guided tour of the posters at their own pace (context-specific). Another option was to create small groups that would move from poster to poster as a unit and respond to questions (Murray et al., 2015). However, to manage power dynamics we opted to invite participants to move around at their own pace and come and go as they pleased. Refreshments were available throughout the event. To invite community members, we created a brightly colored flyer that we shared in a variety of ways – directly emailed to all study participants, community partner clients and staff, elected officials, and government and agency staff, and posted in highly visible areas in each community partner office. Study team members also invited study participants in person when they came to the office for meetings.
One key feature we learned from our colleagues was how to add activities to make the data walk engaging for participants. We learned that we did not just want the posters to stand on their own, but we wanted questions for reflection and action (change-focused) to help guide and shape participants’ experiences. Attached to or posted close to each poster, we included each of these types of questions on a colorful, engaging flyer. Reflection questions titled, “What do you think?” included: “What surprises you?” What is good news?" “What is bad news?” Questions for action, entitled “Call to Action!” included: “How can we update programs to address these issues?” “How can we update policies to address these issues?” “What is one idea you have for policy change, program change, or an action you can take to advance equity?” Each set then had instructions at the bottom for how participants could respond: "Write your ideas on post-it notes and stick below (critically reflective)." We also stationed a team member with a grouping of posters to respond to questions and engage the participants in the reflection and action questions and to capture any ideas that were not added to a sticky note.

Engaging in Discussions about the Data
We also learned about and adopted the participant booklet idea utilized by our colleagues. While they created a scavenger hunt with prizes, our small team lacked the capacity to implement that and instead created a booklet with reflection and action questions with space for attendees to share their ideas (change-focused and critically reflective). This provided them with another way to share ideas with us in case they did not feel comfortable writing ideas on publicly displayed sticky notes.
To make sure the events were comfortable spaces for all invitees, enabling them to view the posters and freely share their ideas, we implemented a number of procedures. First, as described above, we opted for a drop-in style session so that we did not have groups touring the posters together that might include individuals experiencing homelessness, elected officials, and community partner staff, which may have inhibited what attendees felt safe to share. Further, we created ways for attendees to share feedback and thoughts anonymously via sticky notes at each station and in a separate space away from the posters. We also held the events at the community partner offices, spaces that were likely to be comfortable and known, particularly for the most vulnerable participants.
Impacts and Lessons Learned
Thinking through scheduling and set-up was key. The set-up with getting the easels unfolded and posters attached was not a quick endeavor. It was helpful to allow plenty of time or enlist plenty of helpers for set-up and for take down. In addition, the style and durability of posters was an important consideration. One set of posters was used four times and thus it made sense to go to the extra expense of printing posters that were backed with foam core. These were much more durable and yet heavy and cumbersome to pack away, move, and store. The other set were printed on large sheets of paper and thus could be rolled up, stored, and more easily recycled, yet were harder to mount to the easels. This format would have worked well in a space where posters could be mounted directly to the walls.
Very practically, it is key to take the weather into consideration. We wanted to hold our two data walks outside to respect our community partner’s COVID-19 precautions, which included requiring mask-wearing indoors. It was determined to be more welcoming and engaging if we did not have to require masks and thus both events were held outside, one in the blocked off parking lot and the other along the sidewalk at the front of the building. We had 12 posters and portable easel stands. The portable stands did not have strong clips with which to affix the posters (most mounted on foam core board) and thus with a windy day during the first event, one team member was frequently running to catch posters and replace them in the stands. Luckily, the second event day was calm and the posters and stands worked very well.
In thinking about engagement and outreach strategies, we opted to host just one data walk per community and invite all community partners including those who we collected data with, other housing and homeless service providers, and elected officials and other government staff. The first event was attended by elected officials and government agency staff (town manager, town council member, homeless programs director for the county, county commissioner) and no one who shared their stories with us. At the second data walk, attendees were individuals coming to the community partner’s office for services or volunteers with the community partner. In hindsight, we would have liked to conduct separate sessions for those we collected data with and spend more time debriefing with them and talking through policy and practice solutions (conversation-driven). Last, we would recommend pilot testing the posters prior to printing them to make sure they were clear, understandable, and made sense to potential participants.
Finally, dissemination should also lead to action (Daftary, 2018; Feekery, 2024; Pérez-Huber, 2010). We followed the data walks with a policy brief and research presentation that incorporated responses and feedback from the sessions. Both the brief and the presentation were shared with national audiences. What we learned has also been used to guide future research planning and ongoing community service and engaged scholarship. Last, our action took the form of engaging other researchers in how to design and host their own data walks. We created a workshop that was presented in an inclusive hybrid format at UNC Chapel Hill’s Carolina Engagement Week as well as for the lead co-author’s research center. In addition to describing how the data walks were created, we also involved participants in mini data walks so they would have a first-hand experience.
Discussion
This article centers one key method for equitable and participatory research dissemination in research-practice partnerships – the data walk (Murray et al., 2015; Sperling et al., 2025). Using three case studies with specific focus areas (i.e., early childhood and affordable housing), we described our processes for planning, organizing, and implementing data walks within various community settings and demonstrated how our practices aligned with essential characteristics of PAR (Feekery, 2024). Although the specific practices varied by case, all three case studies highlighted the ways in which data walks actively involved community members in the knowledge-sharing and meaning-making process of research dissemination. Each data walk can—and should—be unique to the data being shared, context, and participants. Careful consideration of practical and logistical factors can help to address potential challenges that may arise related to accessibility and engagement and ensure a successful data walk. Next, we describe the practical and logistical considerations that were common across the three case studies.
Selecting a Format and Structure
The overall format and structure of a data walk can either enhance or limit the ways in which participants engage and contribute to conversations. Data walks can be arranged so that participants move freely from poster to poster as individuals and can also be organized so that the same group of people circulates to each poster together. The Educare Lincoln team tried both formats and found that they met different needs. Grouping people together provides opportunity for rich conversations but requires that participants begin the data walk at a specific time, whereas with the alternative format, individuals can flexibly join the event. Regardless of the format, a team member should staff each poster to provide a synopsis of the findings, answer questions, and encourage conversation and reflection among participants.
Location and Timing
Location and timing of the data walk matter as a lack of convenience in these aspects may be a potential barrier to accessibility for participants. Therefore, it is important to think about the location, considering aspects both of convenience (e.g., Is it likely that the intended audience will go out of their way to attend or does the location need to be somewhere they will already be?) and safety and comfortability (e.g., Is this a space where the intended audience will feel psychologically safe and comfortable sharing feedback?). It is also critical to orient participants to the data walk once they arrive by welcoming each participant, providing clear and detailed instructions for the session, and using inclusive language in all written materials, as discussed below. Depending on the target audience, interpreters should be available to make the materials more accessible.
The timing of the event is another key consideration. For instance, each site considered what time of day would be the most suitable for their audience. For the early childhood settings, this was typically deemed to be best held at a time each target audience, like families and staff, would already be on-site. For the data walk in the affordable housing setting, the best time was deemed to be at the end of the workday.
Attendance Incentives
We also encourage hosts to consider attendees’ motivation for attending a data walk and whether attendance needs to be incentivized or supported. Providing meals, continuing education hours, transportation, and childcare are some ways to encourage attendance. All three of the data walks in the case studies presented provided some or all of these incentives and supports. One site, the UNMC LEP, also included an innovative method to incentivize engagement through a scavenger hunt that included small prizes for completion.
Use of Inclusive Language
Language that is field-specific can be inaccessible and off-putting to more lay audiences who can both benefit from the findings and act on them to address injustices. Thus, in organizing a data walk, the audience and message need to be clear – dissemination products for policymakers are going to differ from those for researchers, which are going to differ from those for lay audiences. Moreover, the language used to share and discuss findings needs to be free of jargon, equitable, and inclusive (Buchanan et al., 2021) and maximize impact and actionability (Pérez-Huber, 2010). A key design consideration is that data walk posters do not replicate those produced for academic conferences. For example, most people outside the academy do not regularly come across words like epistemology or praxis. In addition to being clear and simple, poster language should also be inclusive. Resources like the Centers for Disease Control’s (2020) Health Equity Style Guide for the COVID19 Response: Principles and Preferred Terms for Non-Stigmatizing, Bias-Free Language and Schwabish and Feng’s (2021) Do No Harm Guide can provide guidance for inclusive language use. One example of inclusive language is to use person-centered language that reflects people as more than one identity (for example, a person who uses a wheelchair, rather than wheelchair bound). Data displays, such as posters, and written materials should also be accessible to a wide range of reading levels.
Strengths-based Focus
Another critical consideration when sharing data is to use a balanced and strengths-based approach. When reviewing data, particularly for program evaluation as in case studies one and two, it can be easy to focus on areas for improvement. For instance, when sharing data from families with low income or unhoused individuals, highlighting community members’ needs is a natural inclination. However, it is important to ensure that participants’ strengths are centered and that their needs are framed within the larger context, such as systemic inequities and societal barriers being faced. Building trusting relationships where community partners feel safe to provide feedback on the framing of the data—and accepting and incorporating that feedback without defensiveness—is imperative for limiting bias in data sharing practices.
Advantages/Strengths of Data Walks
Overall, data walks provide an excellent and versatile method of research dissemination and engagement because it can be used with many types of data across disciplines and audiences. Importantly, this method also helps to make data accessible to communities for which the work is most relevant and impactful. Versatility is an important factor as building more equitable research practices is essential for all scholars, regardless of the field of study or level of community engagement (Jacquez & Vaughn, 2025). As described next, the processes and practices outlined in this article provide evidence to support the value of data walks in “encouraging community education and engagement on key topics of focus (Sperling et al., 2025, p. 315).”
Opportunities for Debriefing
Debriefing has been integral to the development, improvement, and continuation of data walks. As it is a collaborative and iterative process, debriefing following the event closes the loop by allowing the evaluation and program team to discuss what worked, what resonated, and what needs to be changed, explained or improved. This continuous improvement process has yielded more engaging data walks, introduced adding community partners and parents to invitee lists, led to CEUs being offered, and increased discussions on what data are actionable. The debrief is a good opportunity to hear what data may have been confusing, compile lists of questions around the data, and hear feedback from clients. As evaluators, we often ask educators and others to make changes based upon data and with debriefs we can model doing that which we are asking others to do. By incorporating feedback, the relationships and communication between the entities may strengthen, thus leading to more effective practices overall.
Community Impact and Action
Data walks can lead to community impacts and action. When designing the data walks, researchers will want to consider what they want participants to do with the data presented and make that clear in the verbal and written instructions. Questions to consider may include: 1) Do you want participants to reflect and provide ideas for policy, practice, research, or programming changes?; 2) Do you want them to call their elected officials? For example, at the Winnebago site, data presented spurred further discussions of health indicators, classroom cultural practices, and parents themselves wanting to learn more of the Ho-Chunk language alongside their children. At another site, the information presented on parental depression helped support the addition of mental health supports on site. At a third location, the data led to an increased focus on how to serve families experiencing homelessness. Finally, the data presented encouraged one Nebraska Department of Education employee to wonder if State Board members could attend to see the impact of a high-quality early childhood program on language, executive function, and social-emotional skills. In addition, this work was instrumental in informing other research dissemination plans and teaching other scholars and community members how to design and conduct data walks.
Authentic Engagement
Data walks are just one way of fostering authentic community engagement and public participation in research to address gaps in the policies, practices, research, and conditions that may contribute to disparities within communities. A key component of data walks that was shared across the three case studies presented was the importance of active and meaningful engagement between attendees and the data. The teams at each site implemented various methods of interaction with the data and tailored these strategies to their specific audiences. These methods included preparing questions to encourage discussion, inviting attendees to share their thoughts and reflections about the data both verbally and in writing, presenting data in digestible ways, and creating appealing data visualizations. In each case, the context, culture, and goals of each site were considered key to making the data walks meaningful to those involved – an essential piece in engagement. Notably, these strategies helped to make the data more accessible to a wider range of audiences. By expanding our reach and diversifying our ways of engagement/interaction with the data we can create opportunities for the attendees to offer their insights and perspectives which, in effect, can increase knowledge and understanding, raise awareness of certain community issues and concerns, and create spaces for innovative solutions (Bonney et al., 2016).
Acknowledgement
The Educare Network National Evaluation is funded by the Buffett Early Childhood Fund and the George Kaiser Family Foundation under contract to the Frank Porter Graham Child Development Institute and is conducted in conjunction with the Network’s LEP/NEP Research Consortium. Generous local sources fund each school’s local evaluator. The Robert Wood Johnson Foundation funded the project on structural racism in affordable housing.
The Ho-Chunk language, also known as Winnebago, is the language of the Ho-Chunk people of the Ho-Chunk Nation of Wisconsin and Winnebago Tribe of Nebraska. The language is part of the Siouan language family.