Citizen science engages with the public in a collaborative endeavor that brings together citizens and scientists to tackle questions that researchers cannot feasibly answer alone (Bonney et al., 2014). One example is urban bikeability, which has emerged as an important policy objective in global efforts to mitigate climate change. While there is a considerable body of work defining the determinants of bikeability, it is highly variable and contextual phenomenon in the everyday experience of citizens (Larsen, 2017). This makes bikeability a problem well-suited for the citizen science approach that has the potential to democratize the scientific process, build stronger connections between the research community and the public, elevate the role of science in society, and ultimately, generate new knowledge and advance our understanding of how the world works (Storme et al., 2022).
New technologies have allowed citizen science projects to explode in diverse realms of inquiry (Sauermann et al., 2020). Scholars have adopted citizen science approaches to promote democratic participation (Le Dantec et al., 2016), to help explain the migration of the monarch butterfly through tagging programs (Howard & Davis, 2004), and to discover new celestial features with the help of citizen stargazers (Kuchner et al., 2016). Citizen science is particularly effective when there is a group of committed citizens who are passionate about a particular issue or phenomenon, and these committed volunteers contribute time, data or analytical insights to a larger societal and scientific project (Chase & Levine, 2017). One example are cyclists, who have helped scholars and practitioners to understand patterns in urban mobility and cycling policy (Karakaya et al., 2020; Nelson et al., 2015; Storme et al., 2022). Everyday mobility choices are the result of numerous factors, conditions, perceptions and constraints - most of which escape the eyes of researchers. Decisions about when and how to move, including choices about when to ride a bike, are of interest to researchers because of the environmental and health benefits associated with cycling (Buehler & Pucher, 2021). The mobility itself, and urban mobility specifically, is obviously center stage in the study of sustainable cities (Abduljabbar et al., 2021).
Bicycle users are co-producers of cycling practices based on their everyday experiences (Larsen, 2017). However, the knowledge gained from practice is typically shared only within the tight group of bicycle users, or within families and friends, if shared at all. Insights are scattered across the population, and fragmented knowledge is difficult to mobilize. Citizen science has shown great potential to consolidate, organize and analyze the atomized knowledge, and to generate valuable information for everyday users as well as professionals responsible for managing cycling networks. Crowdsourced information may help cyclists improve their daily cycling routine, assist policymakers with feedback from the cycling community, and generate data for scholars who aim to inform urban mobility policy. Importantly, as Haug et al., (2023) suggest, the unheard voices in city planning and public discussion should be encouraged to participate through citizen science activities – including children and youth (Varaden et al., 2021) and elderly (Wood et al., 2023) for whom cycling may offer independent mobility. Finally, citizen science provides a tool for generating citizen-centric knowledge that can be used in the citizen-centric innovation process such as living labs. As a result, the European Citizen Science Association (ECSA) and the European Network of Living Labs (ENoLL) signed an agreement to collaborate in a methodological approach of both communities (ECSA, 2023), and to develop the value proposition for citizen science in the context of open innovation (Shade et al., 2024).
This paper aims to describe the collaborative development process and lessons learned in the creation of BiciZen – a collaborative and crowdsourcing platform that aims to make cities and regions more bikeable. BiciZen is a mobile phone app that allows users to share information about their cycling experiences with other users and stakeholders. Cyclists can report on bicycle parking, theft, safety, conflicts with other road users, or obstructions in cycle paths. BiciZen also allows cyclists to make suggestions for improvements to cycling infrastructure. Users may also report and share positive cycling experiences through the platform, a feature typically missing from municipal feedback systems. BiciZen may be used by everyday users, cycling advocates, city planners and researchers who would like to document and study cycling phenomena, including patterns of bicycle flows or participation in cycling events.
The BiciZen project was born out of curiosity to learn about how participatory and crowdsourcing technology can support the cycling community, inform policy decisions, and generate valuable data for researchers. In the spirit of citizen science and co-creative research, our project aimed to do more than simply collect and analyze crowdsourced data. A key goal was to involve stakeholders and municipal decision makers to foster a dialogue on municipal cycling policy. We also aimed to ensure that the results are communicated and shared following the 10 principles of citizen science by the European Citizen Science Association (ECSA, 2015).
This paper begins with a literature review on bikeability and then narrows in to discuss other initiatives that have crowdsourced data with the cycling community. In the next sections we describe the methods and the key phases in the platform development, highlighting the key challenges and trade-offs confronted by the development team. We conclude with a synthesis of the key findings from this development process, and lessons learned from the first months of operation of the BiciZen platform.
Research on bikeability
Many studies have attempted to create comprehensive measures and indices of bikeability (e.g. Grigore et al., 2019; Hardinghaus et al., 2021; Reggiani et al., 2021). While consensus on the concept is still lacking, bikeability is generally seen as a more complex set of phenomena than mere characteristics of the physical environment. Hence, it includes the perceived dimension of the environment, community attitudes and behaviour towards cycling, and community systems and culture (Kang et al., 2019). Kellstedt et al. (2020) define bikeability as the extent to which the actual and perceived environment is conducive and safe for cycling. In Hagen and Rynning’s (2021) approach, in a bikeable space the natural and the built environment make cycling possible and enjoyable for both experienced and inexperienced cyclists. They add that bikeability consists of micro-, meso- and macro-level features that separately and together influence cycling mode share and cycling experience. At the narrowest scale, bikeability refers to a person’s physical ability to cycle (Nielsen & Skov-Petersen, 2018). At the broadest scale, it is about land use and transport planning; about assessing the entire cycle network in terms of perceived comfort, convenience and accessibility to key destinations (Lowry et al., 2012).
In existing literature, bikeability is seen as composed of both objective and subjective factors. Objective bikeability has been studied, for example, using geospatial data (e.g. Codina et al., 2022; Madsen et al., 2014), modeling cycle routes using algorithms (e.g. Gholamialam & Matisziw, 2018), and various indices (e.g. Hardinghaus et al., 2021). In turn, research on subjective bikeability has focused on cyclists’ perceptions and experiences, using methods such as surveys and discussions (e.g. Kang et al., 2019; Ma & Dill, 2016). This focus is important because there is often a mismatch between objective and subjective bikeability: An objectively bikeable environment does not necessarily excel in terms of its subjective dimensions, and vice versa. This is because a good cycling environment can mean different things depending on the person and the purpose of cycling. For example, gendered differences in risk perception can make an objectively good cycling environment appear subjectively very different (Ma & Dill, 2016). While for children and youth cycling is something through which they can gain broader independence regarding (urban) mobility (Varaden et al., 2021), for elderly people it may offer a substitute to motorized forms of mobility that may become inaccessible over time (Wood et al., 2023). Moreover, objective and subjective factors affect bikeability differently depending on whether cycling is used for recreation or as a mode of transport (Kang et al., 2019; Ma & Dill, 2016; Porter et al., 2019).
Subjective bikeability has received less attention in the research literature than objective bikeability. The subjective perspective is important because bikeability is difficult to define and measure in a way that meets the needs of all citizen groups. Furthermore, individual cyclists’ perceptions reflect varying degrees of awareness and perception of the cycling environment through senses such as sight, smell, hearing, taste and touch. Moreover, factors such as gender, age, (dis)abilities, social class, personal values, local culture and norms, and past experiences can influence the understanding of these cognitive representations (Haug et al., 2023; Ma & Dill, 2016). Finally, cyclists have heterogeneous route preferences, which means that there is usually no single route between origin and destination that would stand as the optimal cycling route for all individuals (Reggiani et al., 2021).
To better capture the subjective dimensions of bikeability, several citizen science initiatives have been launched over the past decade or so. In the next section we review some of them that we consider relevant as a benchmark to our own BiciZen initiative.
Citizen science initiatives on bikeability
Scholars have developed several citizen science initiatives aimed at mobilizing the knowledge of bicycle users. Many of the platforms have focused on collecting data on cycling safety and route conditions or route choice. Nelson et al., (2015) provide a valuable overview of the crowdsourcing efforts to collect data on cycling ridership, infrastructure, and cycling safety. To benchmark our project, we explored previous crowdsourcing initiatives that shared our goal of working on cycling related topics, grouped by topic below.
In the realm of cycling safety, noteworthy initiatives like BikeMaps, SimRa, and BikeCitizens have emerged to address critical aspects of incidents, near misses, and hazard reporting. BikeMaps is one of the early efforts to crowdsource cycling information, and it was launched in 2014 from the University of Victoria (British Columbia, Canada) with the goal of capturing data on collisions, near misses, hazards, and thefts (Nelson et al., 2015). Near misses are difficult to measure, and yet can be important indicators of cycling network safety. The BikeMaps platform has accumulated 14,473 reports with considerable participation in the United States and Canada (BikeMaps, 2014). SimRa is a platform for collecting data on bicycle routes and near-miss incidents using smartphone-based crowdsourcing (Karakaya et al., 2020). Finally, BikeCitizens is a crowdsourcing app developed by a private company in Austria and Germany, that serves primarily a navigation and route planner tool, and has been used during the Ping If You Care campaigns to map near misses (Gemeente Amsterdam, 2021; BikeCitizens, 2017).
Exploring the theme of bike friendliness and collaborative routing, projects such as the Bike Barometer, Bikeable, Pointz, CycloCat, and CycleAI contribute diverse perspectives and solutions to enhance cycling experiences. The Bike Barometer (Fietsbarometer) digitized 5657 km of roads, of which 3,750 were evaluated for cycling friendliness and safety (Storme et al., 2022). Bikeable is a tool for users and authorities of cycling infrastructure to make riding a bike safer and more attractive (Bikeable, 2021). The users upload photos of places to be improved or of good examples, this is then displayed on a map for open discussion (Bikeable, 2021). Pointz is a routing app for micro mobility users, that helps find routes adapted to the travel needs. The various roads are pre-rated, and it is then complemented by the users reports on bike friendliness and it also allows users to rate the roads friendliness on a scale between 1-5. CycloCat is a collaborative initiative that classifies and documents the safest ways to move between the various cities and villages of Catalonia, Spain (CycloCat, 2016). CycleAI is a private sector initiative that aims to use crowdsourcing data on perceptions of safety to create predictive maps of where cycling accidents are most likely to occur and provides routing algorithms taking into consideration the previous information (Rita et al., 2023).
Focusing on the challenge of obstructions, the Safe Lanes project focuses on reporting cars illegally parked on the cycle lanes (Moran, 2020). The project analyzes the images uploaded to the platform to extract the license plate of the vehicle, the location, and the time (Safe Lanes, 2019). Finally, in the domain of bicycle parking, the Bicycle Parking Project has published a mobile phone app that collects information on the location and occupancy of bicycle parking locations around the world (Burnett, 2024). The BiciZen team used the app to digitalize more than 500 bicycle parking locations, and record more than 800 occupancy measurements, before the BiciZen app was released.
Methods
In this section we describe the collaborative process that led to the creation of the BiciZen platform. From the start, the project has been a multi-university collaboration across five European countries and aimed to engage with the bicycle community to co-create a citizen science platform for data sharing.
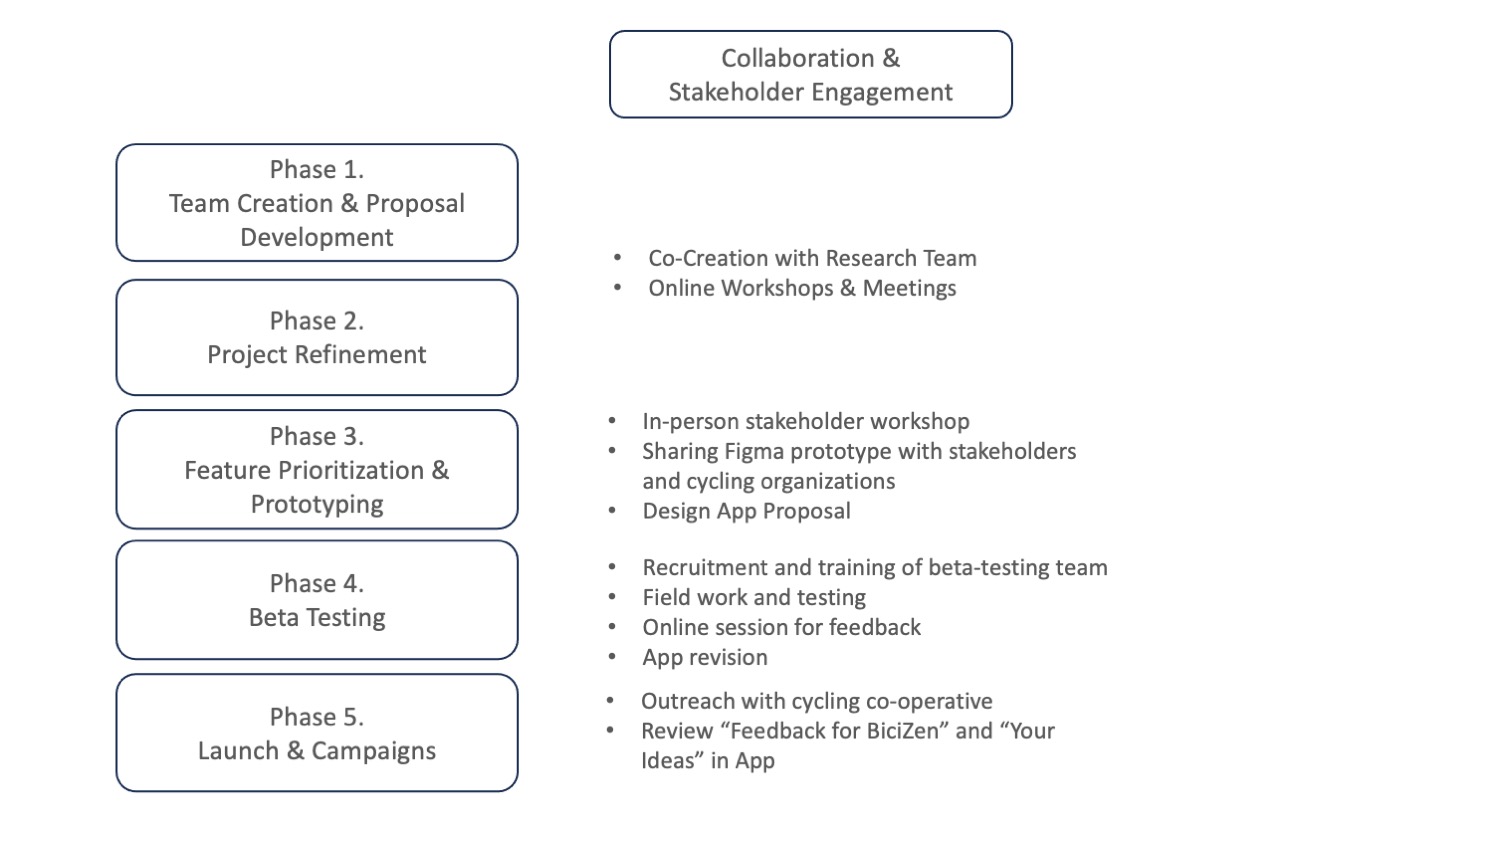
Development process
Phase 1. Team Creation & Proposal Development (February – March 2022)
The BiciZen project was created under a collaborative networking initiative of the SMART-ER Virtual Research Institute, following challenge-based research supported by citizen science to strengthen the ECIU research community and its connection with society (Vilariño & Vinyals, 2022). The BiciZen team met each in February 2022, in a series of virtual networking events and co-creation workshops. Our group coalesced around the idea of creating a collaborative platform for cyclists, and our project was selected as one of the funded projects of the SMART-ER seed program (ECIU, 2022). None of us had prior experience working together and we came from diverse backgrounds in urban planning, geography, economics, engineering, business, citizenship and democracy studies, and computer science. Our initial proposal aimed to allow citizens to report data on three topics:
-
Cycle Path Infrastructure and Road Conditions
To allow cyclists to report safety incidents with other road users, report obstructions related to weather or to the conditions of the cycling network.
-
Bicycle Parking
To allow cyclists to document bicycle parking location, occupancy and bicycle type in on-street parking locations.
-
Bicycle Theft
To allow cyclists to report bicycle thefts and try to help them search for their bicycle and report the theft to the police.
Phase 2. Project refinement (April – September 2022)
Once our proposal was awarded €100,000 in funding by the ECIU SMART-ER program, our team began to refine the pilot project proposal. As a group, we asked ourselves: What are the critical data needs of bicycle users, researchers and policy makers? How can we engage with bicycle users to develop this platform? In which topics do the data needs among the stakeholders overlap? What features should be included in the citizen science platform? And what kind of technological architecture would be the most suitable for the project? To help answer these questions, in May 2022 we organized a three-day workshop with the research team and stakeholders from the cycling community in Barcelona (N=25) (Liebscht, 2022). To contextualize the discussion, the research team presented initial ideas about a collaborative platform for urban cyclists, and then asked the participants to work in small groups on three questions:
-
Problems. What are common conflicts, discomforts or issues that arise when traveling by bike in your city? What are the primary problems and pain points for urban cyclists?
-
Information. What sort of information do urban cyclists need to improve their cycling experience?
-
Feedback. What do you think about the proposed project and ideas presented?
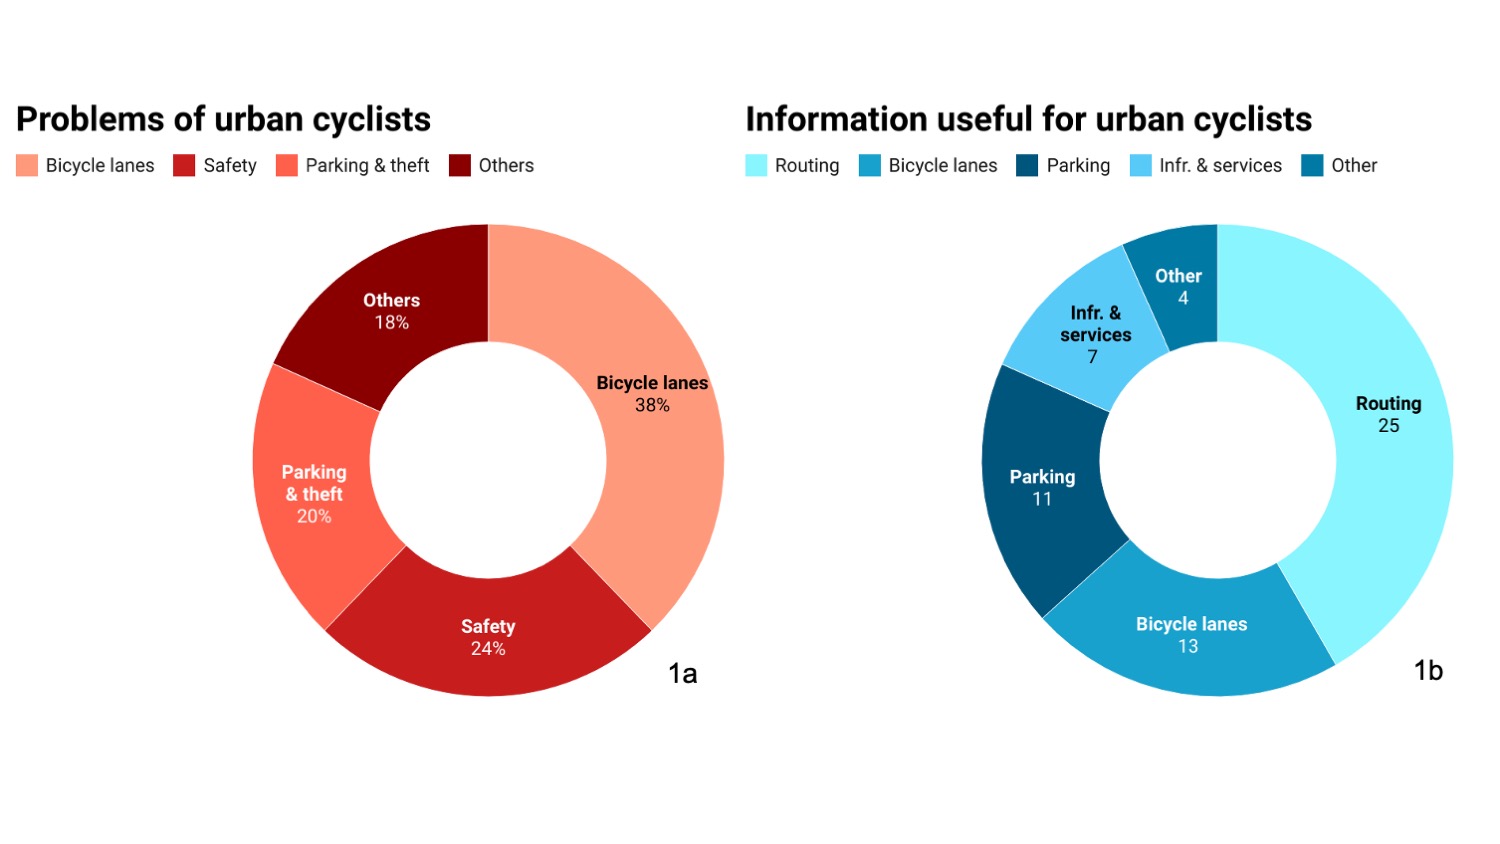
Our engagement with stakeholders helped refine ideas about the collaborative platform, but it also raised new questions and challenges (Honey-Rosés et al., 2024). For instance, stakeholders identified major problems such as the availability and quality of bicycle infrastructure, perceptions of safety, and bicycle theft and bicycle parking (Figure 1a). Bicycle users also made it clear that they wanted information on routing and cycle path infrastructure (Figure 1b). The demand from workshop participants for information on navigation and routing presented a challenge for the research team because this required a high level of technological expertise, which we probably could not to deliver.

The workshop revealed that the bicycle users had additional ideas about how a collaborative platform might support different kinds of cyclists. In addition to the initial three topic areas that we proposed (bicycle parking, theft, cycling path maintenance), the conversations in the workshop revealed interest in developing tools to support route choice, public engagement and AI/machine learning applications. For example, some saw the project as more about creating a new way for the public to engage with city officials and with each other, with a focus on engagement between users. This approach would direct the tool to focus more on text analysis of the qualitative feedback provided by users. Others advocated for a more technologically sophisticated tool that could analyze images using machine learning to produce a unique and novel platform.
In addition to the workshop, we contacted stakeholders in the pilot cities. In Tampere (Finland) we reached out to city and regional officials. In Aveiro (Portugal) we reached out to the local cycling association, CiclaAveiro for feedback on the proposed idea of a collaborative platform for cyclists. And in the Netherlands, we also reached out to the national cycling organization however they were skeptical about the long-term viability of citizen science apps for bicycle users. This early feedback showed that there were different levels of interest at each pilot site.
We assessed these new possible platform features against feasibility criteria (i.e. were we capable of creating such a tool or feature?), the research value of collecting data with that feature (i.e. would data collected with this feature help us answer a valuable research question?), the interest of users (i.e. are cyclists interested in this?), the interest of municipal governments (i.e. are municipal governments interested in this?), the extent to which the topic was innovative (i.e. is work new, novel or not done elsewhere?) and if there was internal interest from our diverse research team. As a team, coming from different backgrounds and working in different contexts, internally we also had different interests because some topics were relevant in some cities or countries but not in others. For instance, bike theft was a high priority issue for the researchers in Barcelona and Aveiro, but of less interest to colleagues in the Netherlands and Finland.
Given the feedback and the trade-offs that emerged from the stakeholder workshop, we aimed to focus the discussion on which features to include in the platform, rather than on the technological architecture to support them. A group of co-authors worked on a discussion paper to allow the team to comprehend the available options and make an informed choice on our technological choices and how it might relate to the selected features. The first decision concerned whether the project aimed to build (i) a crowdsourcing tool e.g. a smartphone app, (ii) a collaborative platform e.g. a citizen science platform, (iii) an open data platform for cycling data, or (iv) a combination of the previous ones. We decided to go with option (iv), with the Barcelona team taking the lead on the development of a collaborative platform in the form of a mobile app.
Then we needed to decide if we were going to (i) build the entire system internally, (ii) build on extend or customise existing software, or (iii) to outsource to a third party. A subroup of co-authors developed a discussion paper with options discussed. The final decision depended on the project team’s perspective on a number of factors including platform, features, performance, design, documentation, training & support, cost & return on investment (ROI). Ultimately, however, the final decision was based primarily on the resources available, both human and financial. Consequently, we decided to pursue option (ii) and to build on and customise the Spotteron citizen science platform (Hummer, 2018). Spotteron is a digital platform specializing in citizen science, environmental monitoring, and community engagement. It provides custom apps for projects that allow users to collect, share, and analyze data, particularly in environmental and scientific research. The Spotteron platform allows researchers to customize modules and data collection tools with an attractive number of features within a limited budget. Using Spotteron had the advantages of allowing the use of many pretested features, a faster time to release and the guarantee of getting a bug-free app. The disadvantage was a loss of control over the code and dependence on Spotteron for updates and maintenance. The research team made this critical decision, with input from the stakeholder workshop in mind. We committed to continue working with the cycling community and stakeholders in the development and testing of the BiciZen platform using Spotteron technology.
The way Spotteron stores its data is integral to how it supports these projects. Spotteron uses a cloud-based infrastructure for data storage. This ensures scalability, reliability, and accessibility. The cloud environment allows them to handle varying amounts of data depending on the needs of different projects and users. Given the nature of the data collected, which can include sensitive environmental data and personal user information, Spotteron emphasizes data security. This involves encryption, secure access protocols, and compliance with relevant data protection regulations, such as the General Data Protection Regulation in Europe. All the data contributed can be accessed by the public and the steps for downloading the data are described at https://www.bicizen.org/data/
Phase 3. Feature prioritization and prototyping (Sept 2022 – Feb 2023)
Once we had chosen Spotteron as our technology provider, we focused on how to use Spotteron features to fulfill the project needs. This process opened new opportunities because Spotteron tools could allow us to collect more types of data beyond what we initially envisioned (cycle path maintenance, parking & theft). We saw that we could also collect data on perceptions of safety, conflicts, and bicycle flow counts. At this point, we began to create a data tree that structured the button choices and options for users. To evaluate the data structure tree, we created mock-ups with Figma, which was particularly valuable for communicating what BiciZen would look like to stakeholders. With the Figma mock-up, the research team was able to pull out a realistic using looking app on our phone and show it to potential users, friends, or research collaborators. For instance, at the Smart City World Expo and Conference in Barcelona in November 2022 we had a booth location with our university and were able to share the application in development with conference participants. The Figma mock-up allowed us to engage in many conversations about the application in a critical period in which the app was still being developed and there was room to make improvements.
To improve usability, we organized the app into two main functions: a citizen report and a citizen proposal. Conceptually, we felt that a ‘report’ and a ‘proposal’ were sufficiently different to merit this distinction, and dividing functions in two distinct categories allowed us to provide users with more ways of contributing to the platform without excessively cluttering the main prompt.
In the report section, cyclists can report information in the following categories:
-
Happy cycling: to report positive cycling experiences
-
Conflict: to describe conflicts with other road users
-
Obstruction: to report obstructions on cycle paths
-
Safety: to report perceptions of safety
-
Parking: to report the location of bicycle parking spots and their occupancy.
-
Theft: to report stolen bicycles or bicycle parts
-
Group cycling: to share the experience of cycling together in a large group
-
Bike counts: allows users to report how many bicycles move through a street segment, road or bicycle lane
The proposal section, cyclists to propose their own ideas, categorized in:
-
New cycling infrastructure: to propose a new cycling infrastructure.
-
Cycling together: to propose a route to cycle together with others.
-
Your ideas: to make a proposal outside of the current categories.
-
Feedback for BiciZen: to allow users to share what should be improved and added to BiciZen.
We organized the app structure, content and functionality in a master document submitted to Spotteron on 22 November 2022. Once we had agreed on the content, the Spotteron team developed design proposals for each of the app sections, and we received this preliminary design proposal on 20 December 2022. The platform is global in scope and available in multiple languages (English, Spanish, Portuguese, Dutch, Finnish, and Catalan).
Phase 4. Beta Testing (February – March 2023)
The beta version of Bicizen was released on the Google Play store on 16 February 2023. In this stage, we aimed to trial the platform among a small group of beta testers who could provide feedback. We anticipated that we could feasibly recruit 5 to 10 users in each location to use the app and provide feedback. The beta testing was a key opportunity to receive feedback from users because at this stage would could still incorporate this feedback into the next version of the phone app (Figure 2).
While we were not able to reach the anticipated level of beta testers in the Netherlands and in Finland, the Barcelona beta testing group included 20 individuals who participated in two workshops: an initial launch beta-testing workshop and a debrief event where we discussed the platform and reviewed how it could be improved. We received a total of 45 ideas to improve the app from the four locations that were categorized into project related (27), platform related (13) and language related (5). The team evaluated the feedback and shared the results with the developers. During this beta testing period the platform received 636 contributions. Of those, 77% were from the research team, 16% from the beta testers and 6% had been imported from other sources.
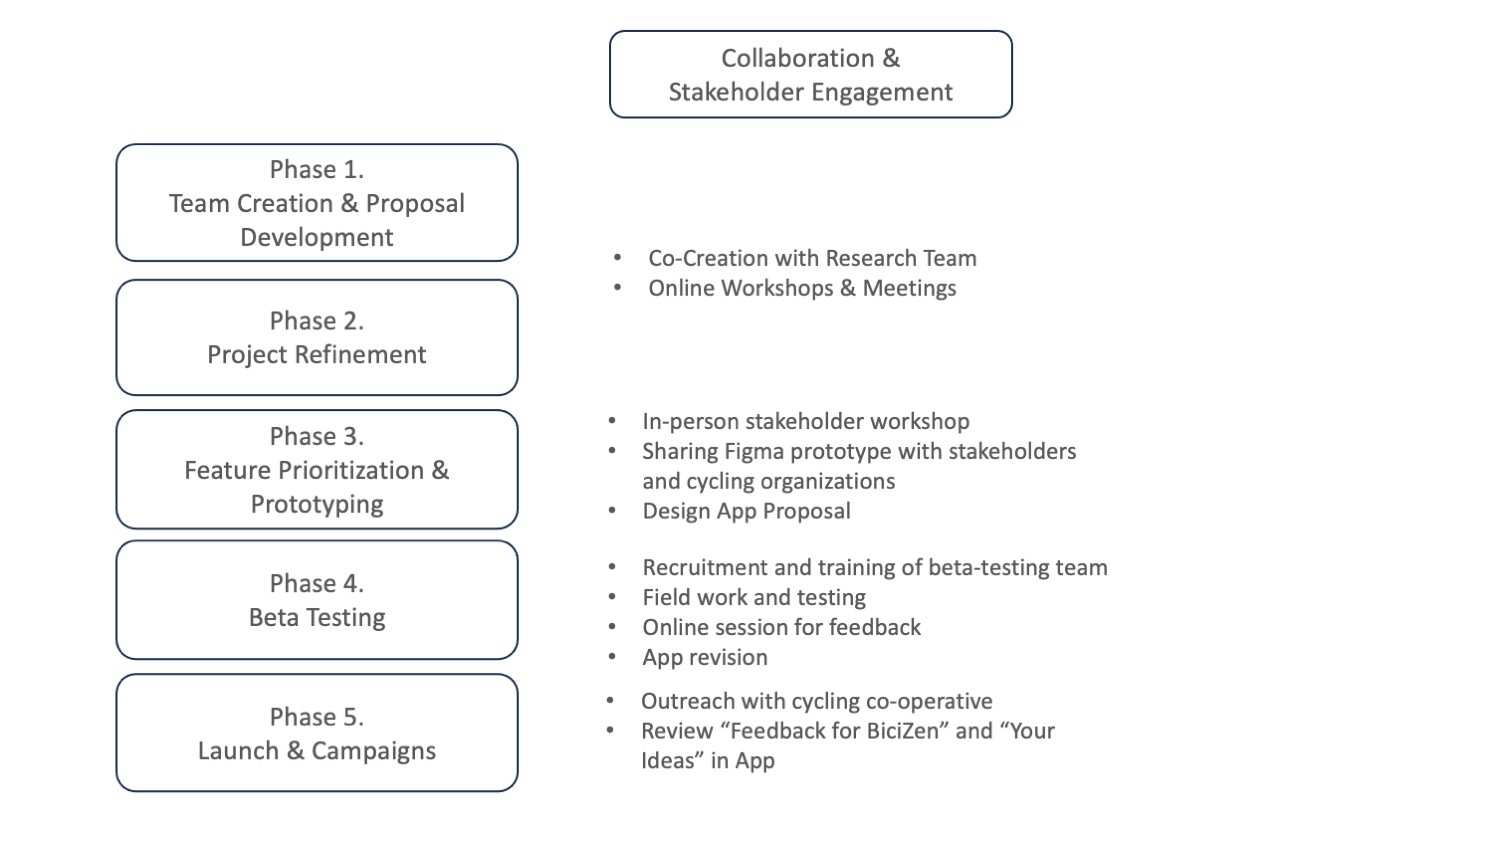
Phase 5. Launch & Campaigns (June 2023 – December 2023)
BiciZen was launched to the public on 5 June 2023. We promoted it through our respective university websites, the newly created social media accounts, and various newspapers and radio programs. In Barcelona, the team also participated in various local events such as the Science Festival (Festa de la Ciència), Festa de la Bicicleta, the Parking Day and neighborhood festivities.
A student was hired to help with the communication and the management of the social media accounts. The Barcelona team also collaborated with a local cycling cooperative (CUBIC) that supported the promotion of the platform. CUBIC was hired to develop communication content, promotional material such as t-shirts, stickers, and flyers. They also attended media events to speak on the program on behalf of the team. During the launch phase, we were also able to receive platform feedback through the “Feedback for BiciZen” and “Your Ideas” segments of the App.
In August 2023 the research team imported 1305 observations on bicycle parking from a previous study in 2021 (Honey-Rosés et al., 2023). In December 2023, the research team imported an additional 237 bicycle parking occupancy reports collected in 2022.
Results
In this section we describe the data contributions to the BiciZen platform in the first ten months of operation (February-December 2023), which includes four months of beta testing plus six months since public launch in June 2023. In this period, the app has had 1,594 downloads, 990 on Google/Android and 604 in Apple/iOS. We begin by describing basic patterns in the data contributed and then reflect on the lessons learned from the development of the citizen science platform.
Total contributions
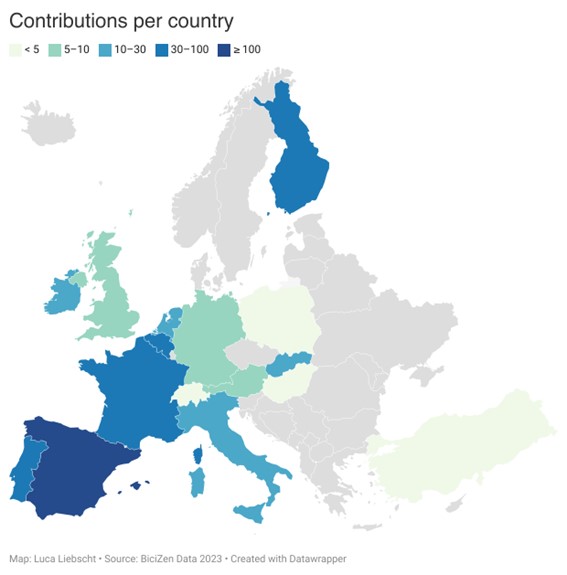
In the first ten months the BiciZen platform collected 5,571 contributions from 203 users in 23 countries. The contributions can be disaggregated into contributions made by new users of BiciZen (n=2,229), data imported from past work (n=1,751), and contributions from the BiciZen research team (n=1,591). There are also 110 deleted contributions.
Distribution of contributions
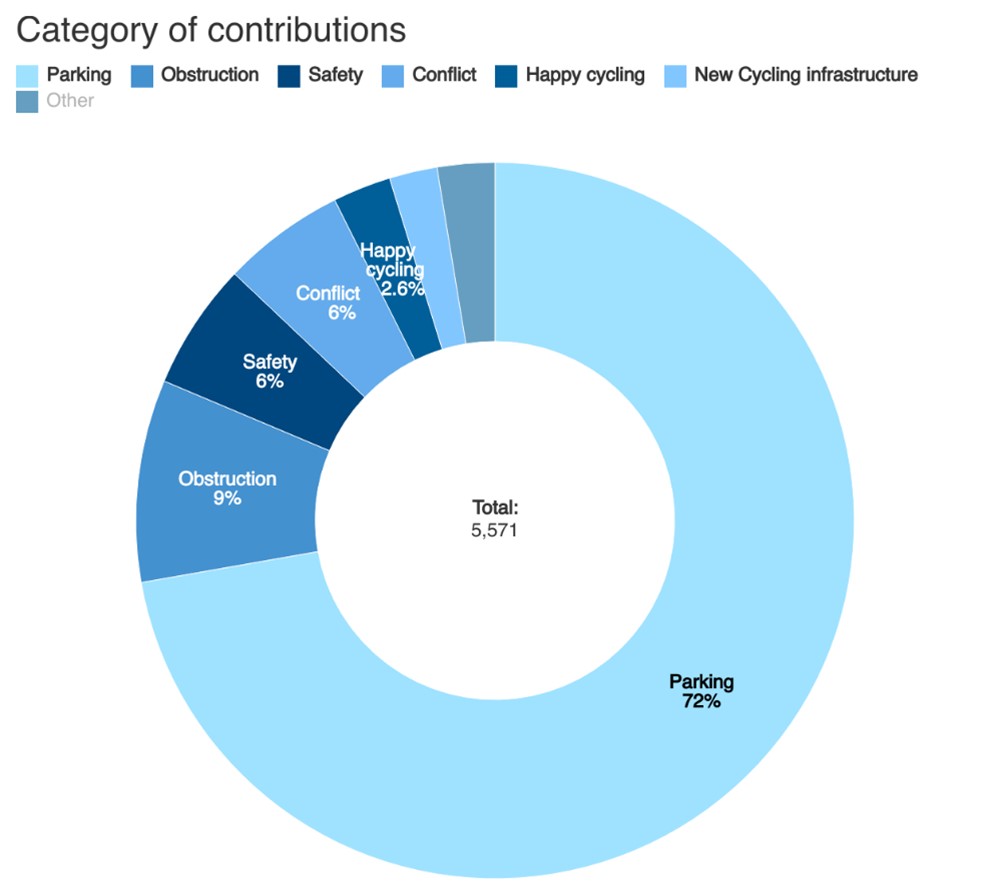
By category
The contributions are not evenly distributed by category (Figure 3). Observations related to bicycle parking account for 72 percent of contributions, followed by obstruction (9%), conflict (6%), safety (6%), happy cycling (2.6%) and new cycling infrastructure (2.2%). The high number of bicycle parking locations can be partially explained by the fact that 1,751 bicycle parking contributions were imported from a previous study by the research team (Honey-Rosés et al., 2023). Still, even without this imported data, reports on bicycle parking were common, presumably because reporting the number of bicycles parked at a location is easy. Contributions related to safety increased during a campaign related to the maintenance of cycling infrastructure with a local cycling organization (Chaves et al., 2023).

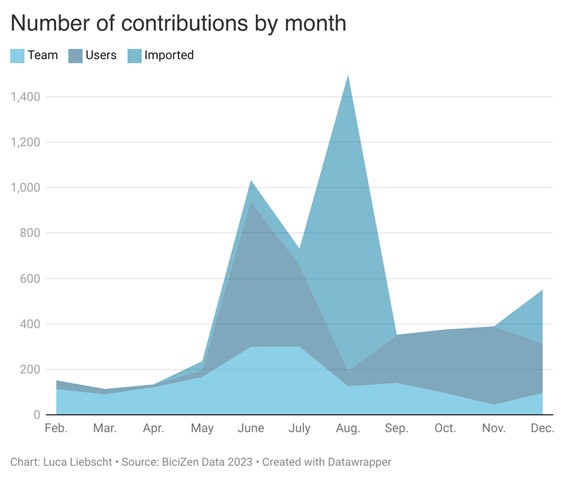
By month
The activity in the platform has been irregular, with a relatively stable number of contributions during the beta testing, a peak period after the launch, a lull in August and a stabilization during autumn (Figure 4).

By region
As a European project, it is not surprising that most contributions have been in Europe. In the early stages of project conceptualization, the research team based at the University of Twente lowered our expectations regarding possible uptake in the Netherlands, where there had been some previous failures with cycling apps. In contrast, we were hopeful about BiciZen’s potential in Barcelona, especially given our planned collaboration with local groups and investment in local communication and outreach.
We find considerable differences in the number of contributions by location, with 92% of contributions located in Spain of which 52% were in Barcelona. Then we see that Finland, Belgium, France and Portugal have 1.1%, 0.7%, 0.7% and 0.6% contributions respectively (Figure 5).

From a global perspective, we can see that most of the contributions have been made in Europe (5,535), followed by North America (124), South America (14), Australia (6) and Asia (1).
Users
We estimate that <1000 individuals have downloaded the app onto their phone based on the 500+ downloads in the Google Play store and 100+ downloads in the Apple Store. A total of 203 users have created an account with BiciZen and we have explored their patterns of contributions and engagement in the platform.
We find that most contributions to the BiciZen platform are made by a very small group of users. Engagement in the platform follows a power law distribution (sometimes referred to as the ‘pareto principle’), with many users making few contributions and a few users making most of the contributions. Most users are low frequency users (< 5 contributions) and they make up 67% of the user base. Most of the low frequency users are one-time users (n=137) that have made only 7% of all contributions. ‘Regular contributors’ are those who have made between 5 and 50 contributions, and these comprise 29% of all users and 24% of all contributions. However it is not the ‘regular contributors’ who are generating the most content for the platform. Instead, we find that it is a small minority of 8 ‘super-users’, who represent only 4% of the user base, yet who have made 69% of the contributions to the BiciZen platform. These user trends are consistent with existing research on citizen science participation (see, for example, Boakes et al., 2016; Chozas et al., 2023; Sauermann & Franzoni, 2015). Researchers suggest that this phenomenon may be explained by a wide range of factors including the citizen’s perceived fit between the project and both their expectations and their skills, privacy concerns, digital-divide issues, and other socio-demographic factors, amongst others (Allf et al., 2022; Sauermann & Franzoni, 2015).
We can also examine the length of time that users stayed engaged in the platform. Long-term engagement is difficult to achieve since many users are willing to test new platforms but quickly discontinue involvement. BiciZen was able to maintain engagement with over a quarter of users (28%) for at least three months, and up to 12% of users remained engaged for six months. On the other end of the spectrum, 34% of users only used the platform only once, and 16% made more than one contribution but only on the same day and did not return.
BiciZen Applications
In the summer of 2023, a cycling organization in Barcelona (Bicicleta Club de Catalunya – BACC) reached out to BiciZen to propose a collaboration. They were interested in documenting the conditions of cycling infrastructure in the city of Barcelona, and found that the BiciZen platform could be an easy way for many cyclists to collaborate and share information about what they saw. The cycling organization was particularly interested in documenting places where the infrastructure was in disrepair, such as traffic separators that had been dislodged from its proper spot. While the BiciZen research team had initially intended to devote our efforts to a campaign on bicycle parking, we chose instead to collaborate with the local cycling organization, we adjusted our campaign plans, and responded to the needs and interests of our partners. During the months of September and October 2023, we collaborated on a campaign to report maintenance issues in the city of Barcelona, and together, documented places where the cycling infrastructure required more attention (Chaves et al., 2023).
Lessons
Finally, we aim to synthesize six lessons from the project development and early launch.
Lesson 1. The feedback process is resource and time intensive
The development of the BiciZen platform underscored the extraordinary amount of time and resources that are needed for a participatory, collaborative or co-design process with stakeholders. Engaging with stakeholders requires months of planning, organization, feedback, synthesis and integration. We found it difficult to maintain the same level of commitment and engagement with stakeholders across all our pilot cities, despite our shared interest in co-development.
It was resource intensive to synthesize the information and feedback from our different sources and then incorporate that feedback into our decisions, especially when we encountered competing interests pulling in different directions. Each form of engagement required synthesis and integration, including conversations with policymakers, cycling associations, the workshops and the beta testing process.
The beta-testing process itself was resource intensive. We needed to recruit beta users, organize introductory sessions, respond to questions, compile feedback, synthesize feedback and determine which comments were actionable and which were out of scope of our project. Integration of feedback into the decision-making process was particularly difficult. The key decisions remained led by the research team.
Despite the time and resources invested into our beta testing group, it was surprising that this group did not gain a sense of ownership in the project once launched. We anticipated that our beta testers would be our primary users, having gained a sense of co-ownership of the project. However this did not turn out to be the case, as our star super-users were individuals who had no prior relationship with the research team and were not involved in beta-testing.
Lesson 2. We confronted a tension between functionality and simplicity
We navigated a constant tension between keeping the platform simple and easy to use, versus adding more data collection features that could benefit more users (researchers, municipal officials and cycling advocates). The trade-off between functionality and simplicity was a recurring theme in our conversations. The platform’s navigation structure allowed us to offer more features and collect more data than what we had initially envisioned, and eventually, we opted for more functionality, at the expense of simplicity. This came with the disadvantage that BiciZen was more difficult to explain to users. Unlike other apps, which focus on a particular topic, such as road conditions or bikeability (Storme et al., 2022), safety (Rita et al., 2023), obstructions (Moran, 2020), or bicycle parking (Burnett, 2024), BiciZen allows users to report on many topics. This is both a strength and a weakness. As a large group of researchers, aiming to engage many types of stakeholders in various cities and contexts, for us it made sense to offer a wide variety of functions for users.
Lesson 3. The interests of researchers, public officials and citizens do not necessarily align
The development process revealed that the data needs and interests of researchers, policy makers and citizen bicycle users do not necessarily align, even when these stakeholders share a commitment to making our cities more bikeable. We found that questions of interest to the research community were not necessarily of interest to cycling advocates or municipal leaders. Therefore, a challenge in the creation of BiciZen was to find the alignment of interests between stakeholders.
For instance, our workshop with stakeholders from the cycling community in Barcelona revealed that users were most interested in gathering information about route navigation. However, as researchers, we were not prepared to generate a route choice model that could compete with existing platforms (Google, Geo-Velo), nor were we ready to track users and use that data on bicycle routes. An app that tracked users would generate huge volumes of data and open privacy issues that would complicate the development of the platform. Therefore, while bicycle users may be interested in data on route choice, as researchers we felt like we were not prepared to collect and analyze this data for a scientifically valuable research output.
Similarly, municipal managers were interested in data pertaining to their specific municipality that might take substantial effort to collect, while not producing an innovative scientific contribution. Municipalities were also concerned about expectations generated by feedback from citizens. Local authorities in Tampere were concern with the useability of the produced data, as well as the potentially unwarranted expectations generated by feedback on cycle path maintenance. In Barcelona too, city officials were hesitant to engage with any platform not developed by the city themselves.
And the data that we were interested in obtaining as researchers, had the disadvantage in that it generated a high response burden on users (safety, parking) and did not provide users with immediate value. Therefore, a key challenge was to find points of alignment among competing interests. We partially resolved these by incorporating multiple data functions in the platform that appealed to multiple users and interests.
Lesson 4. Most contributions are from a few highly committed users
BiciZen contributions were highly lopsided, in terms of who was contributing, where and what types of contributions were made. We found that 69% of contributions were from 4 percent of users. A few loyal and committed super-users have been essential to generate platform contributions, and keep momentum behind the project. These super-users showed their commitment to documenting their city. For instance, user bicicletabcn focused on documenting the cycling experience in Barcelona (408), while user Mamaanega documented cycling in the city of Terrassa (381) and user Ernest documented conflicts and obstructions in the city of Sant Cugat (137).
It is surprising to see that mid-sized cities are the focus of many of the contributions. We also see more interest in low cycling cities and contexts. BiciZen was launched in four pilot cities, and using a social media platform with global reach, however our user base is highly lopsided with more than half of contributions in the Barcelona metropolitan region. While BiciZen was able to capture the occasional users in Argentina, Brazil, Australia, and Turkey, 81% of contributions were in Catalonia. Maintaining engagement in the platform is a central challenge to citizen science projects (Ferster et al., 2017). The lopsided use of the platform by super-users suggests that the key to growth may be connecting with the most committed, through targeted campaigns or word of mouth rather than developing more generalized campaigns to the broader public. This finding also raises new research questions about what motivates the super-users and how to leverage their contributions with the regular users.
As a platform collecting data from a select number of users, one may be concerned that the information is not ‘representative’ of the general public or the cycling community. This might be true for perceptions of safety or happy cycling in which perceptions may vary by individual. And yet we see value in allowing users to identify locations that may be perceived as unsafe, even by just a few users. Also, we trust that other users and public officials will understand that the contribution may be coming from a single user. If comments on that topic or location accumulate, there might be good reason for further exploration. And for other fields, such as observations of bicycle parking, bicycle theft or bicycle counts, we are not concerned about the ‘representativeness’ of the user because they are simply contributing an observation or data point.
Lesson 5. BiciZen was used as a data repository
We did not expect citizens to use BiciZen as a data repository to share cycling incidents, images or conflicts that they had collected as concerned citizen in past projects. For these users, BiciZen served as a useful platform to share the information previously collected but did not have the place to share it widely. We did not anticipate that BiciZen would serve as a public storage place for past projects, nor did we anticipate that users would have the patience to upload so many observations using the web-tool. Many of the most detailed text descriptions came from users who uploaded photos and commentary from sites, places and incidents that were collected a few years back. For instance, the user ernest documented the evolution of the construction of cycling infrastructure in the city of Sant Cugat (Barcelona). Similarly, the user Mamaanega chose to use BiciZen as a repository to store the harassment data collected through the Association of Cyclists in Terrassa (BiTer). In this way, BiciZen served as a platform to visualize and store such data in an organized, open and collaborative way.
Conclusion
Our project aims to gain a better understanding of urban and regional mobility, public engagement and cycling through a citizen science platform that empowers urban cyclists with relevant travel information and supports cities in their transition to a low-carbon mobility future. We have used a collaborative process to create a new research tool for crowdsourcing data on the everyday cycling experience (Honey-Rosés et al., 2024). This tool contributes to ongoing efforts to generate co-creative processes and exchange between citizen cyclists, policy makers and the research community. BiciZen has been well received, generating 5,571 contributions in less than one year, and helping build community through the process of learning and exchange. The platform is providing an outlet for sharing insights about conflicts and issues found in cities and regions. We hope that this is just the beginning of a project that may help us learn how citizen users may contribute to both science and public policy on urban mobility.
However the creation of collaborative platforms – even when there are abundant contributions, does not guarantee that it will produce innovative science. While we have created a functioning platform with a steady user base, considerable effort will be needed to ensure that BiciZen can make an innovative contribution to knowledge. Future research will need to focus and target data collection campaigns, and collaborate with municipal leaders or cycling organizations. We see potential in working with municipal managers in documenting the everyday cycling experiences in their municipality.
Many critical questions around the use of crowdsourcing technology for bicycle users still remain. To what extent and how does a collaboration platform contribute to shared decision-making, policy impact and co-governance? In which ways does a collaborative and crowdsourcing platform allow the cycling community to make a meaningful contribution to municipal cycling policy? What are the effective means for motivating citizens to participate in crowdsourcing and collaborative tools? And how can collaborative platforms concurrently strengthen democratic and sustainable urban development? While these questions are up for debate, we sense that collaborative platforms are more likely to succeed when there is co-ownership, a collective identity, a shared sense of purpose, and a clear outcome on can be envisioned in the near future.
Looking ahead, the platform may be used to document bicycle parking patterns in the city, with a focus on locations with saturated bicycle parking, and the extent to which private dockless bicycles are collapsing on-street bicycle parking, especially in high-tourist areas (Honey-Rosés et al., 2023). We are also interested in learning about the potential to use BiciZen to document bicycle theft, and support the development of a bicycle ridership model (Miah et al., 2024) that incorporates perceived gender and age.
Public policy plays a crucial role in bicycling safety and its bicycle adoption (Pucher & Buehler, 2010). However, strong policy design needs to be grounded in the user experience (Mayers & Glover, 2021), including inter-municipal governance in city-regions (Lidström & Schaap, 2017). This is not only a practical matter but involves democratic dimensions as well: in liberal democracies, citizens have a right to take active roles in the development of their city and public spaces, and in this sense, practice ‘cycling citizenship’ (Aldred, 2010).
Acknowledgements
This project has been funded by the ECIU SMART-ER program. This project has received funding from the European Union’s Horizon 2020 research and innovation programme under Grant Agreement #101016888. This result only reflects the author’s view and the EU is not responsible for any use that may be made of the information it contains. JHR has been supported by the Ramón y Cajal Fellowship (RyC-2019-027279-I) and the Spanish Ministry of Science, Innovation and Universities through the “María de Maeztu” program for Units of Excellence (CEX2019-000940-M). We are grateful to the stakeholders and Beta Testing team of the BiciZen project for their input. We also acknowledge the contributions of Eduard Folch and Alejandro Martín Barraza from CUBIC – Cooperativa de Usuàries de la Bicicleta.