

Community-oriented research is based on reciprocal partnerships where communities and researchers work together to improve health outcomes and achieve research goals. This type of research relies on the lived experiences of community members to inform and guide the research process (Moczygemba et al., 2023). The implementation of these practices empowers community members to transition from their conventional role as research “subjects” to a more collaborative and equitable position as co-researchers (Odedina et al., 2024). This shift democratizes the research process and fosters a sense of ownership and active participation among community members, thereby enriching the quality and relevance of the research outcomes (Potnis & Gala, 2020). It signifies a transformative approach in research methodology, where knowledge is co-created through mutual learning and shared expertise. This paradigm shift underscores the value of each member’s contribution and reaffirms their integral role in the research process.
One challenge in creating partnerships between academic researchers and community members is in the methodological approach. When addressing complex issues with multiple contributing factors, it is crucial for researchers to employ language and research methods that are accessible and comprehensible to the community members. This approach facilitates better understanding and participation and ensures that the research outcomes are actionable and relevant to the community. The use of plain language helps to bridge the knowledge gap and fosters an environment of mutual respect and understanding. Moreover, research methods that are easy to understand and implement empower community members to actively participate in the research process, thereby enhancing the validity and applicability of the research findings.
Mapping Tools
The use of visual aids, such as mapping tools, provides one way to engage community members in the research process and integrate them into the methodology of research practice. Mapping typically involves using pictures or visual representations of data to connect ideas and help groups brainstorm solutions to complex problems. Mapping allows the group to propose, categorize, and rank potential solutions in response to a common problem (Kane & Trochim, 2007). It also allows team members to visualize values that unite the team and to define the ways that culture plays a part in the process of finding solutions (Sánchez et al., 2021).
One such tool is mind mapping (Buzan & Buzan, 2002), which encourages participants to organize pieces of data and their interactions by drawing connections (Crowe & Sheppard, 2012). Mind mapping creates a visualization of ideas (Buzan & Buzan, 2002), but it allows for creativity and can encourage brainstorming (Davies, 2011). A similar tool is concept mapping (Trochim, 1989) which creates a map based on hierarchical prioritization of ideas (Trochim et al., 2004). It allows research teams to quantify qualitative data and to show the relationship among ideas generated by the community (Johnsen et al., 2000). While both of these mapping techniques, as they were originally created, have concrete steps to follow, they are well-suited for adaptations that fit the purposes of unique communities (Rosas & Camphausen, 2007). By using a community-oriented research approach in combination with mapping, researchers can get real-life examples and tangible solutions to health problems that are specific and relevant to the community.
Mapping tools are described as research methods but are useful in the context of community based participatory research as a way to engage community members in the research (Windsor, 2013), especially in cases where systems-level changes may be warranted (Smith et al., 2021). Previous literature focuses on the importance of mapping to create culturally sensitive interventions with communities on mental health outcomes (Giabbanelli et al., 2022; S. Moyce et al., 2022), substance misuse treatment (Humphreys et al., 2022), and infectious disease prevention (Nguyen Quoc et al., 2022). While a handful of studies use mapping tools to address barriers and facilitators to cancer screenings, most focus on the African American community (e.g. Carmack et al., 2023).We add to existing literature by describing how we worked with a Hispanic community advisory board to integrate two mapping tools to investigate potential disparities between non-Hispanic White women and Hispanic women in accessing preventive breast and cervical cancer screenings across three counties in southwest Montana.
Context
Montana, like other states in the Mountain West, is a rural, predominately White, English-speaking state with a population of Hispanic immigrants that has doubled in the last decade (Pohl, 2017). Hispanics experience disproportionately higher barriers to accessing health care than non-Hispanic Whites for a variety of reasons (Crane et al., 2019). Cultural differences are a large part of this disparity, and Hispanic persons tend not to engage in the care continuum due to a lack of providers who speak their language, understand their culture, and are geographically accessible to them (Misra et al., 2021; S. C. Moyce et al., 2021; Olagunju et al., 2018). This is particularly acute in a rural setting where the geography often prevents residents from accessing needed medical care (Waks & Winer, 2019).
The Centers for Disease Control and Prevention (CDC) and the Division of Cancer Prevention of Control administer the National Breast and Cervical Cancer Early Detection Program (NBCCEDP) to provide cancer screenings to women who are low-income and uninsured or under-insured (Lantz & Mullen, 2015). Each state directs the program operations and the organization responsible for local implementation. Breast cancer is curable in approximately 80% of women, especially when diagnosed early (Waks & Winer, 2019). However, rates of cancer diagnosis and survivorship differ among women of different ethnicities. Compared to non-Hispanic White women, Hispanic women are often diagnosed with more advanced disease, have lower five-year survival rates, and have a lower quality of life (Crane et al., 2019). Hispanic women also report lower levels of knowledge about their breast cancer and lower levels of satisfaction with the quality of their cancer care (Olagunju et al., 2018). In Southwest Montana, where the NBCCEDP is administered by the county health department, Hispanic women were less likely to complete recommended screenings when compared to non-Hispanic white women.
These disparities point to a need to reduce barriers to screenings for Hispanic women. Funded by the Robert Wood Johnson Foundation, our research team undertook a project to examine the reasons for these disparities by conducting a series of semi-structured interviews with women enrolled in the program. The methods and results of that community-based participatory research project are presented elsewhere. In this article, we describe our methods of engaging a community advisory board and conducting mapping exercises designed to create solutions to address the structural racism in breast and cervical cancer screenings.
Figure 1 maps the different stages of the process described in the following sections, the stages at which the community advisory board (CAB) was involved, and the tools used at each stage. It also references the outcomes produced from the analysis.

Community Advisory Board
After receiving approval from the Institutional Review Board at Montana State University, we took the strategic step of assembling a Community Advisory Board (CAB) by purposefully inviting four women based on their backgrounds and experiences with the NBCCEDP. Each of these women identified as Hispanic, adding a layer of cultural relevance to our research. However, it is noteworthy that only three were Spanish-speaking, presenting an interesting dynamic regarding language diversity within the group. Among these women, three (two who spoke Spanish and one who did not) had previously undergone cancer screenings through the NBCCEDP program. All of the women held significant roles within their local Hispanic community. Their leadership was exercised through various platforms, such as the church, health clinic, and a local Mexican food store. Their influence and reach within the community added a valuable dimension to our CAB.
In recognition of their time and contribution, each woman received a compensation of $100 after every meeting. This gesture was not just a token of appreciation but also an acknowledgment of the value of their insights to our research. Their lived experiences and understanding of the community enriched our study and made our approach more inclusive and grounded in reality.
Our first meeting was designed to introduce the women to one another and the members of the research team, as well as to describe the research objectives. While community-engaged research in its purest form develops the research question in partnership with the community (Parra-Cardona et al., 2020), our research team created the research question without involving the CAB. This was due to the nature of the funding mechanism and the proposed purpose of the study, which was to examine barriers for Hispanic women in the NBCCEDP. We did, however, ask the women for feedback on our proposed study design and data collection methodology. They told us they thought interviewing persons enrolled in the program would provide valuable insight into potential barriers to accessing screenings. At the first meeting, we obtained written commitment from the CAB for their continued participation and engagement in the process and consent for their participation.
Next, the research team drafted interview questions to be used in data collection, and the CAB provided edits on a second group meeting. We then pilot-tested the interview questions with two of the CAB members and completed further edits based on their feedback. The CAB approved our final semi-structured interview questionnaire.
Soliciting Community Feedback
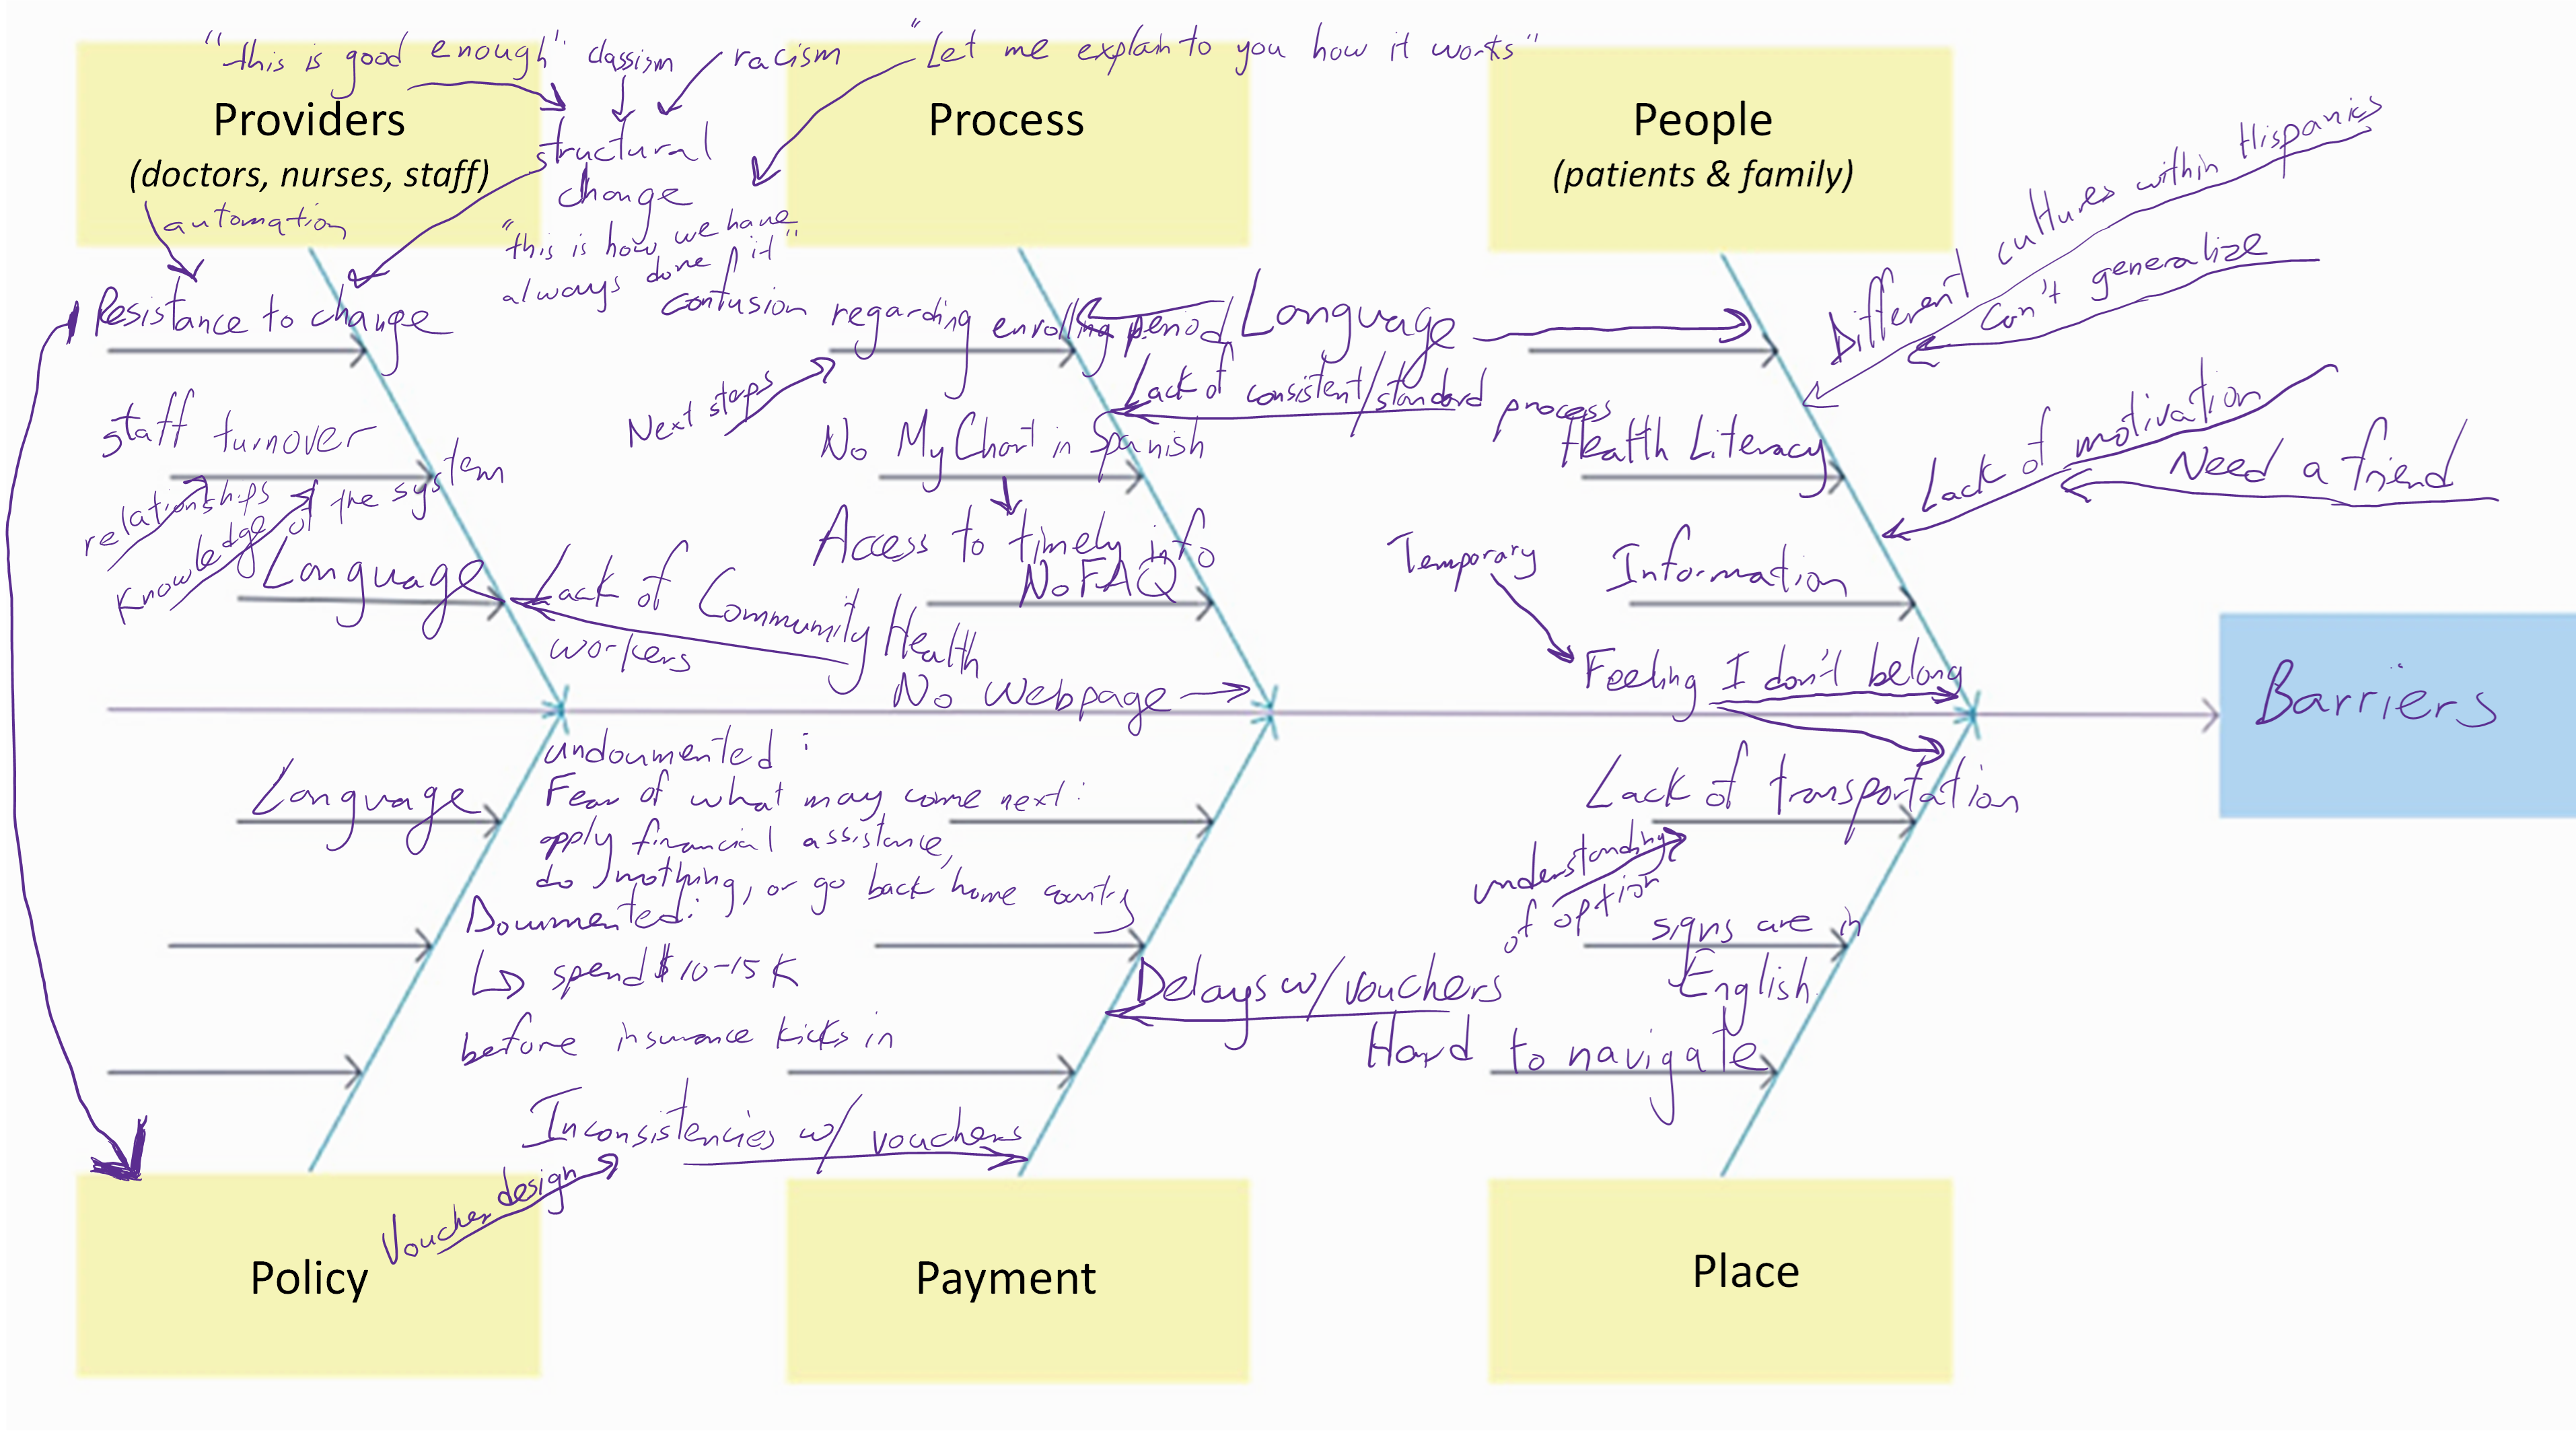
The next step in the research process was to work with the CAB to interview women about their experiences with the NBCCEDP through semi-structured interviews. The interviews were conducted by two members of the research team over the course of three months during spring 2022. Upon the completion of the interviews, we analyzed data in a two-step process. First, the research team organized themes from the transcripts into a structured format known as a fishbone diagram. The fishbone diagram, also referred to as the Ishikawa diagram or cause-and-effect diagram, is a widely used tool in process analysis (Ilie & Ciocoiu, 2010; Wong et al., 2016). Its primary function is to systematically identify and categorize the potential contributing factors to a specific event or outcome (S. Moyce et al., 2022). The unique name of the diagram is derived from its distinctive shape, which resembles a fish. In the context of the fishbone diagram, the “head” of the fish symbolizes the event or outcome under investigation. Extending from the “head” are the “bones,” each representing a contributing factor or cause linked to the event. These “bones” are typically grouped into categories to provide a comprehensive overview of all possible causes.
We categorized the contributing factors, based on published categories (Loredana, 2017; Nelson et al., 2011), as follows: 1) providers who were responsible for program administration or execution and healthcare workers, including imaging personnel; 2) people were the patients and family members; 3) process included factors related to the enrollment or administration of the program; 4) place included factors about the referral agencies, health clinics, and the imaging center; 5) payment included factors related to billing and financial responsibilities; and 6) policy included factors related to the program itself and its administration. (See S. Moyce et al., 2024, for details.)
This systematic approach allows for a thorough exploration of the complex interplay of factors contributing to the event, facilitating a deeper understanding of the underlying processes. It is a powerful tool that aids in identifying areas for improvement, formulating strategies, and driving effective problem-solving (Ilie & Ciocoiu, 2010; Wong et al., 2016).
The second step in the analysis was to share the transcripts with the CAB and invite them to create their own fishbone diagram and fill in each category based on what they saw in the data and based on their own experiences and their knowledge of the community at large. This phase of the research was conducted over the course of three meetings. The first meeting (group meeting #3 overall) was conducted to introduce the analysis approach and fishbone diagrams to the CAB and to solicit initial feedback. We then asked each CAB member to complete a draft of factors that facilitated completing screenings on their own while thinking about their community. We met a second time (group meeting #4) to discuss these fishbones, obtain consensus, and create a unified fishbone of the facilitators identified by the CAB. Each CAB member then independently completed a second set of fishbone diagrams, identifying the barriers to completing cancer screenings. We met a third time (group meeting #5) to create a unified fishbone of the barriers. We compiled both diagrams created by the CAB representing the barriers and facilitators, shared those with the CAB, and asked for their feedback. Figure 2 presents the resulting combined fishbone diagram generated by the CAB.

Proposing Solutions through Mapping
The final phase of the process was to generate potential solutions to improve breast and cervical cancer screening rates. We invited a consultant to lead these efforts. The consultant is a doctoral-prepared health systems engineer and expert in process improvement methods, including the methods we employed in our research. She is also a Hispanic woman.
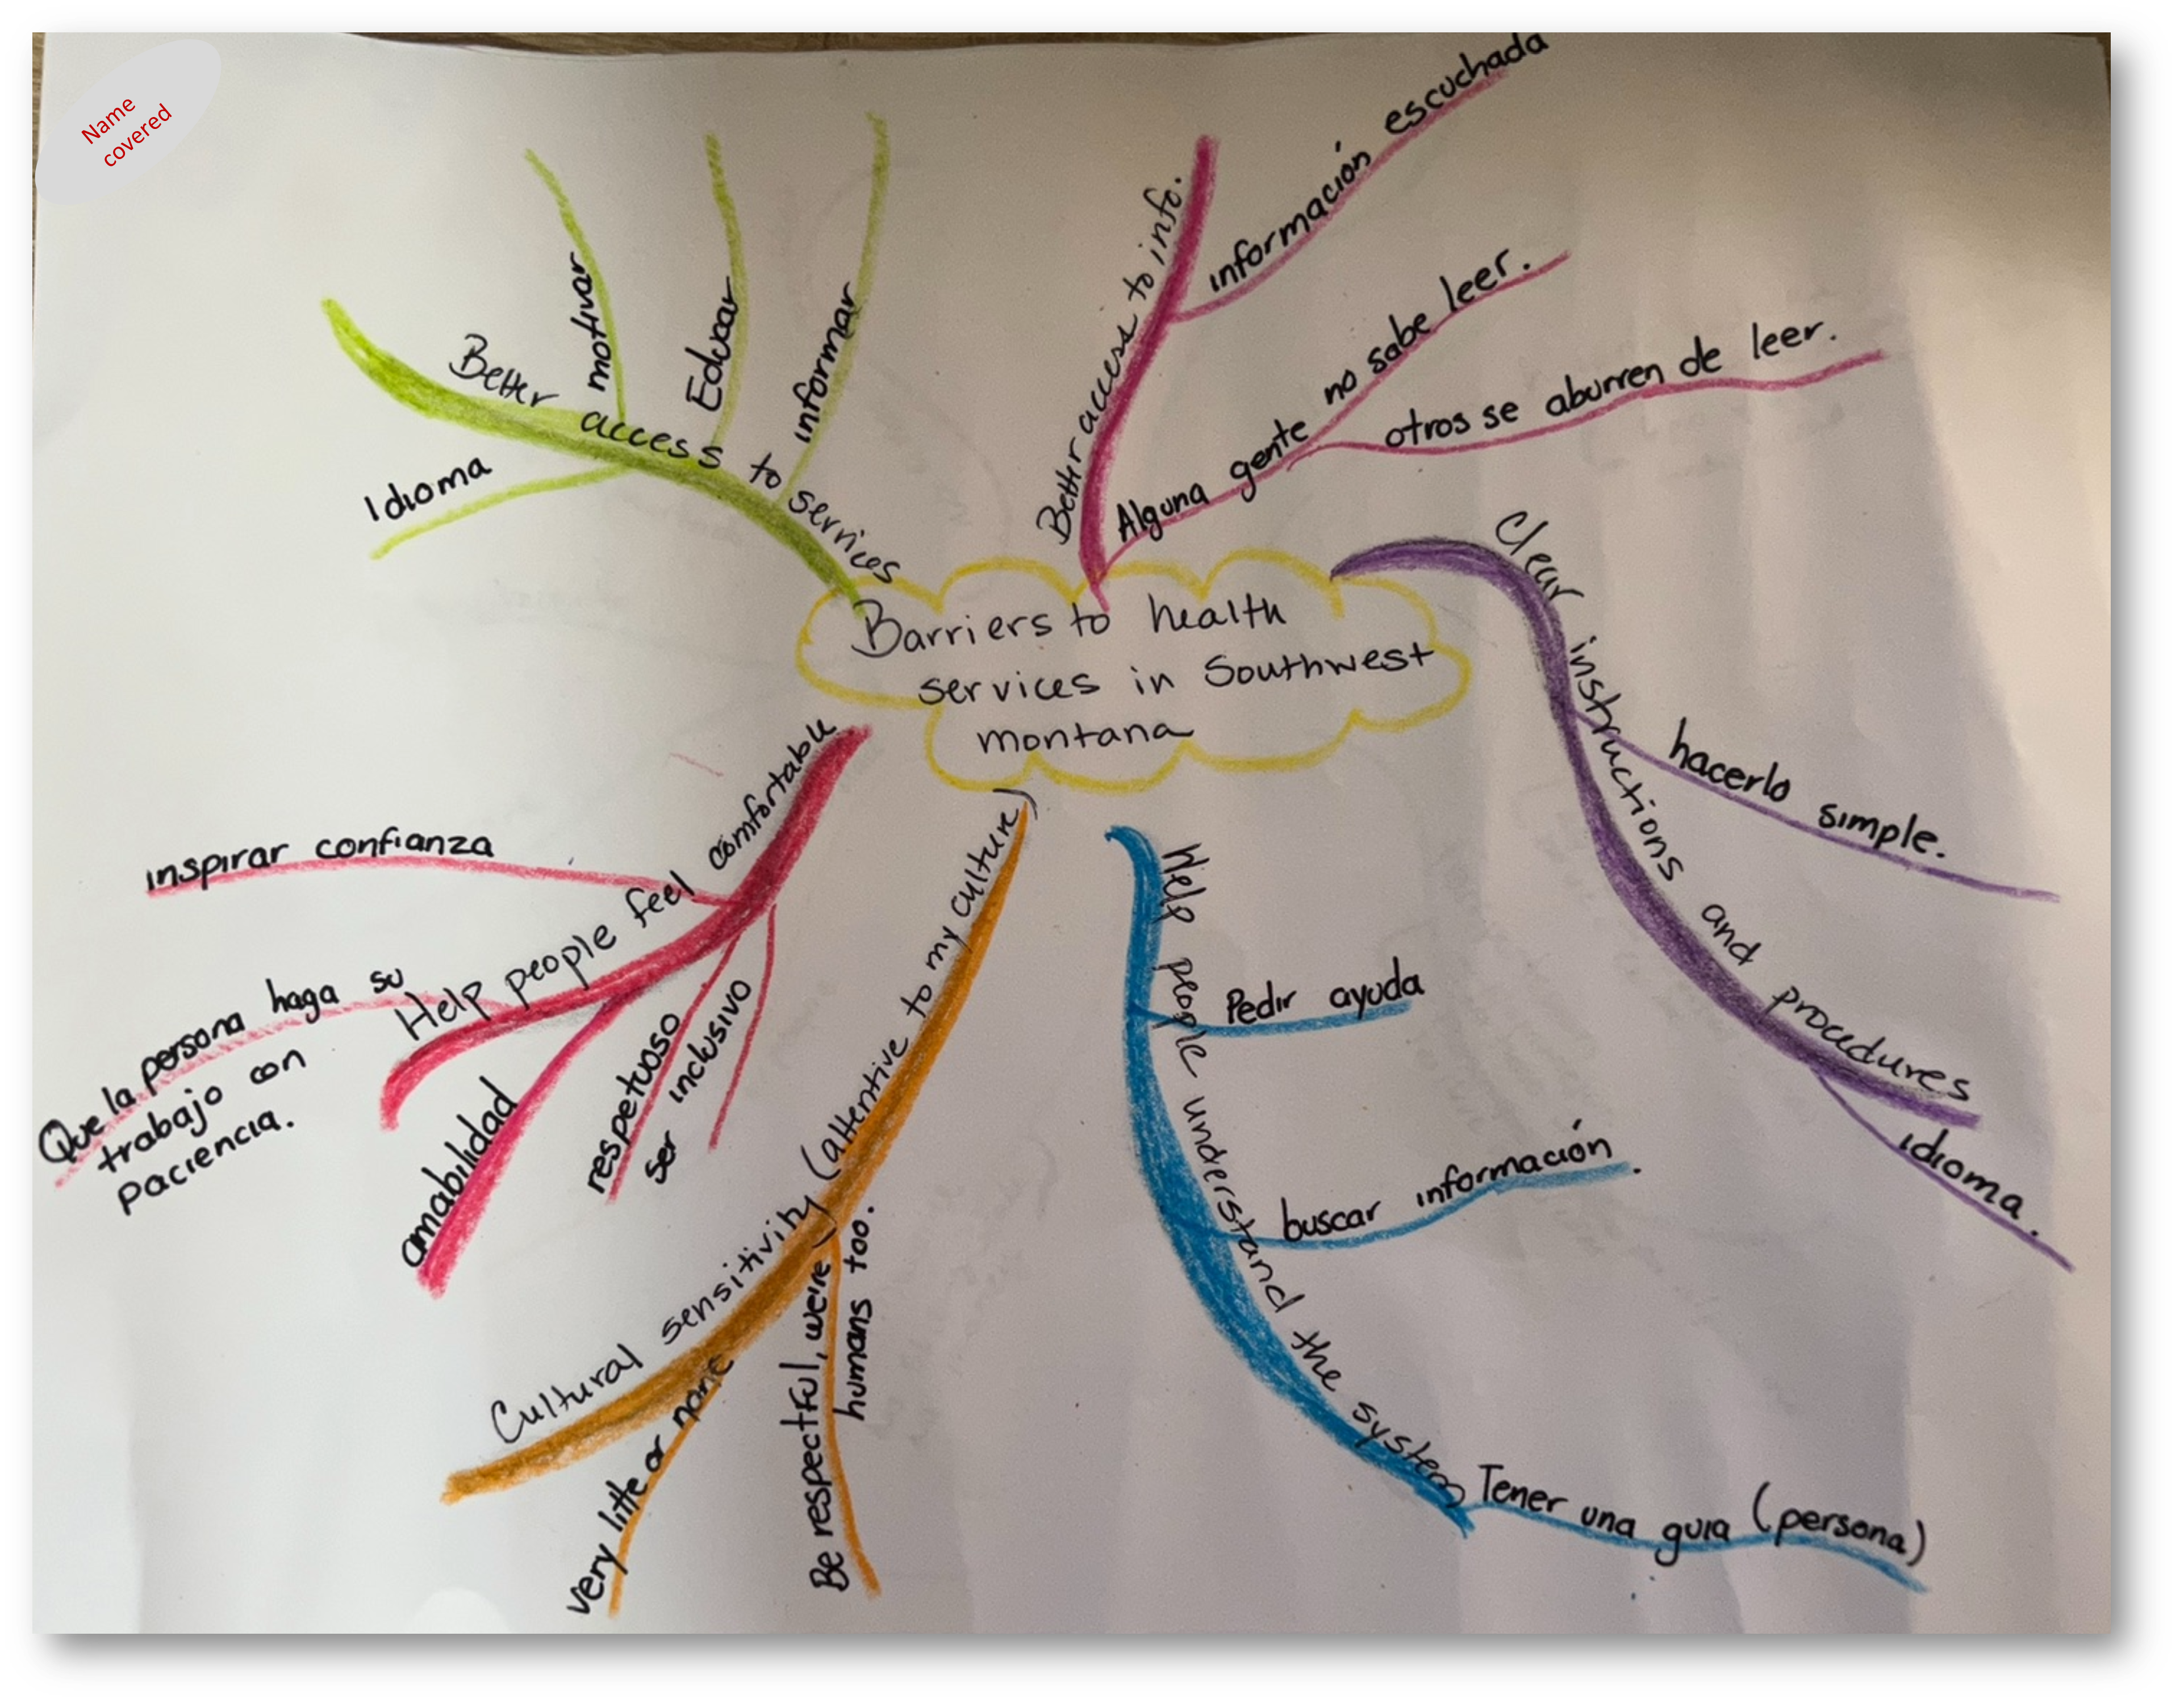
Mind Mapping. Prior to this exercise, a member of the research team combined all data from the fishbones into lists of barriers and facilitators, separated by categories (see Supplemental Material). After the CAB reviewed the compiled lists of barriers and facilitators from the fishbone diagrams, the consultant asked the CAB and the research team to complete a mind-mapping exercise. It began with a central problem (in our case, barriers to accessing screenings) and used colors and lines to show relationships between concepts. See example in Figure 3.

To create a unified set of mind maps, the consultant provided a template with the branches from the central problem, generated from the fishbone diagrams: better access to services, better access to information, clear instructions and procedures, help people understand the health system, and help people feel comfortable. Each person on the research team and the CAB independently created a mind map, brainstorming potential solutions that mapped to each of these categories.
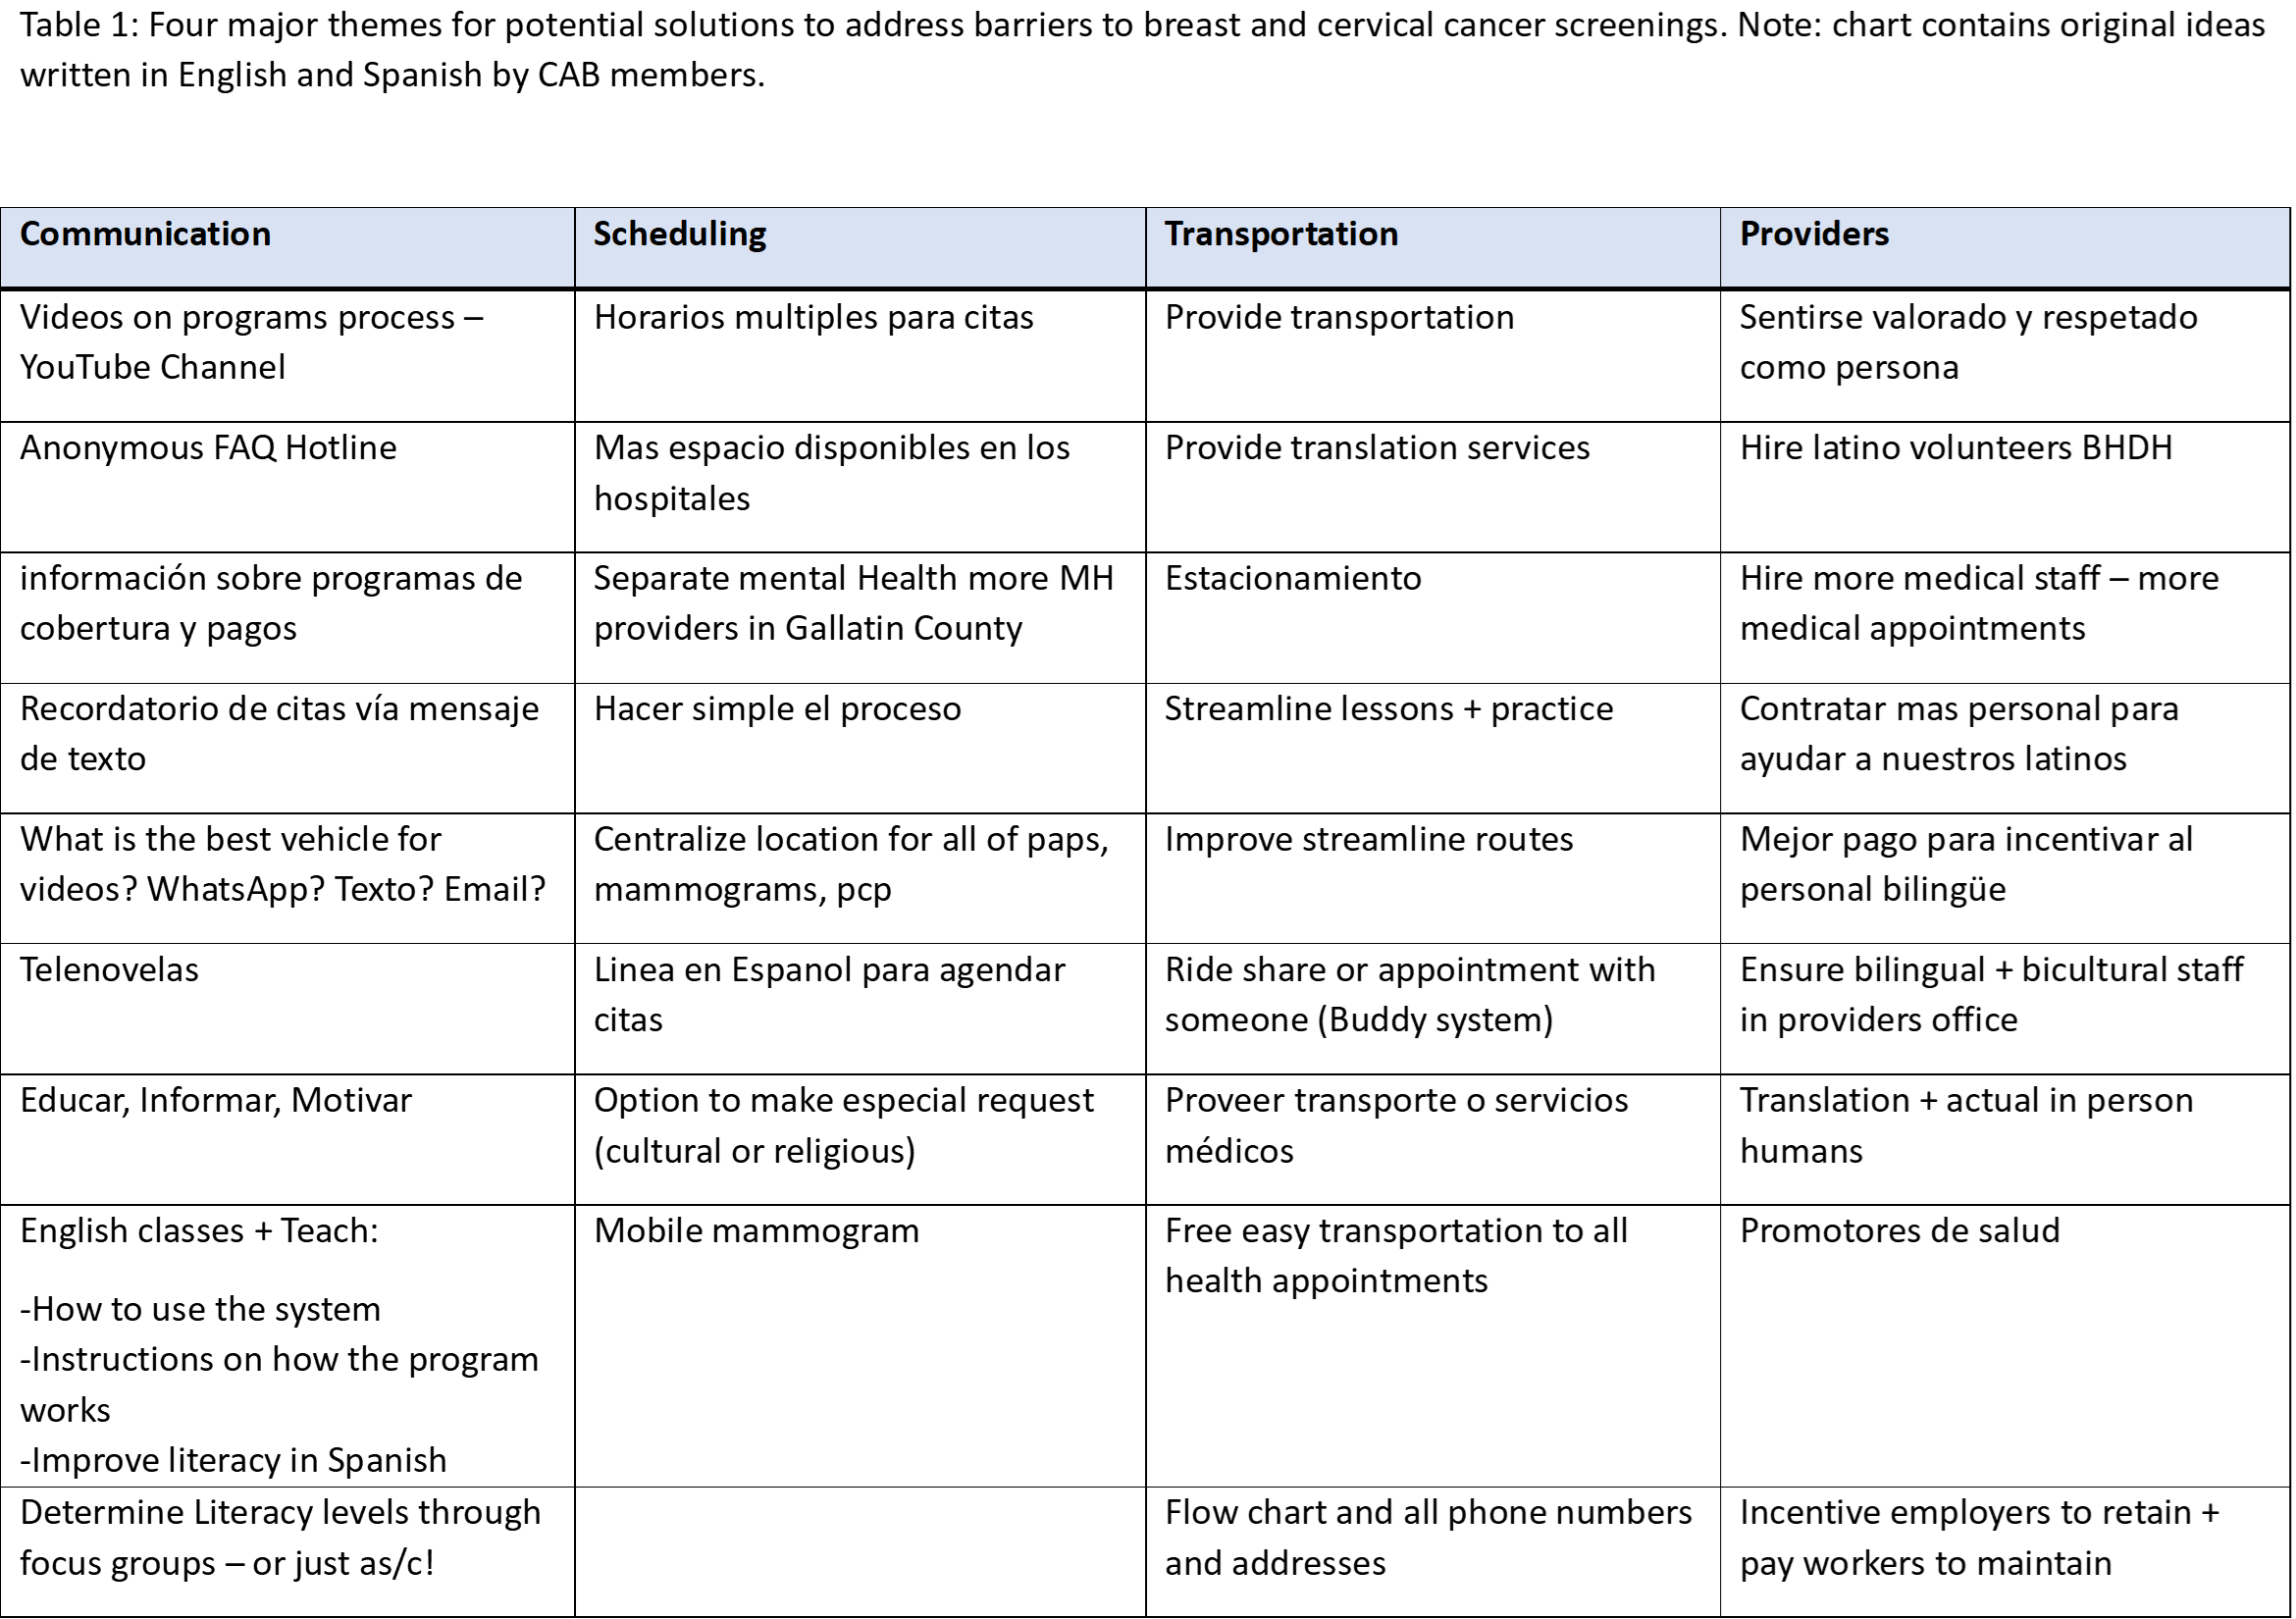
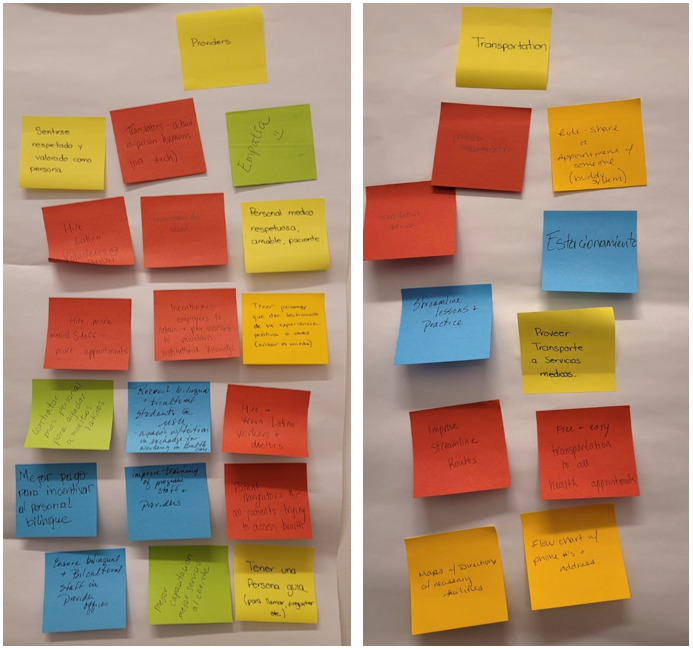
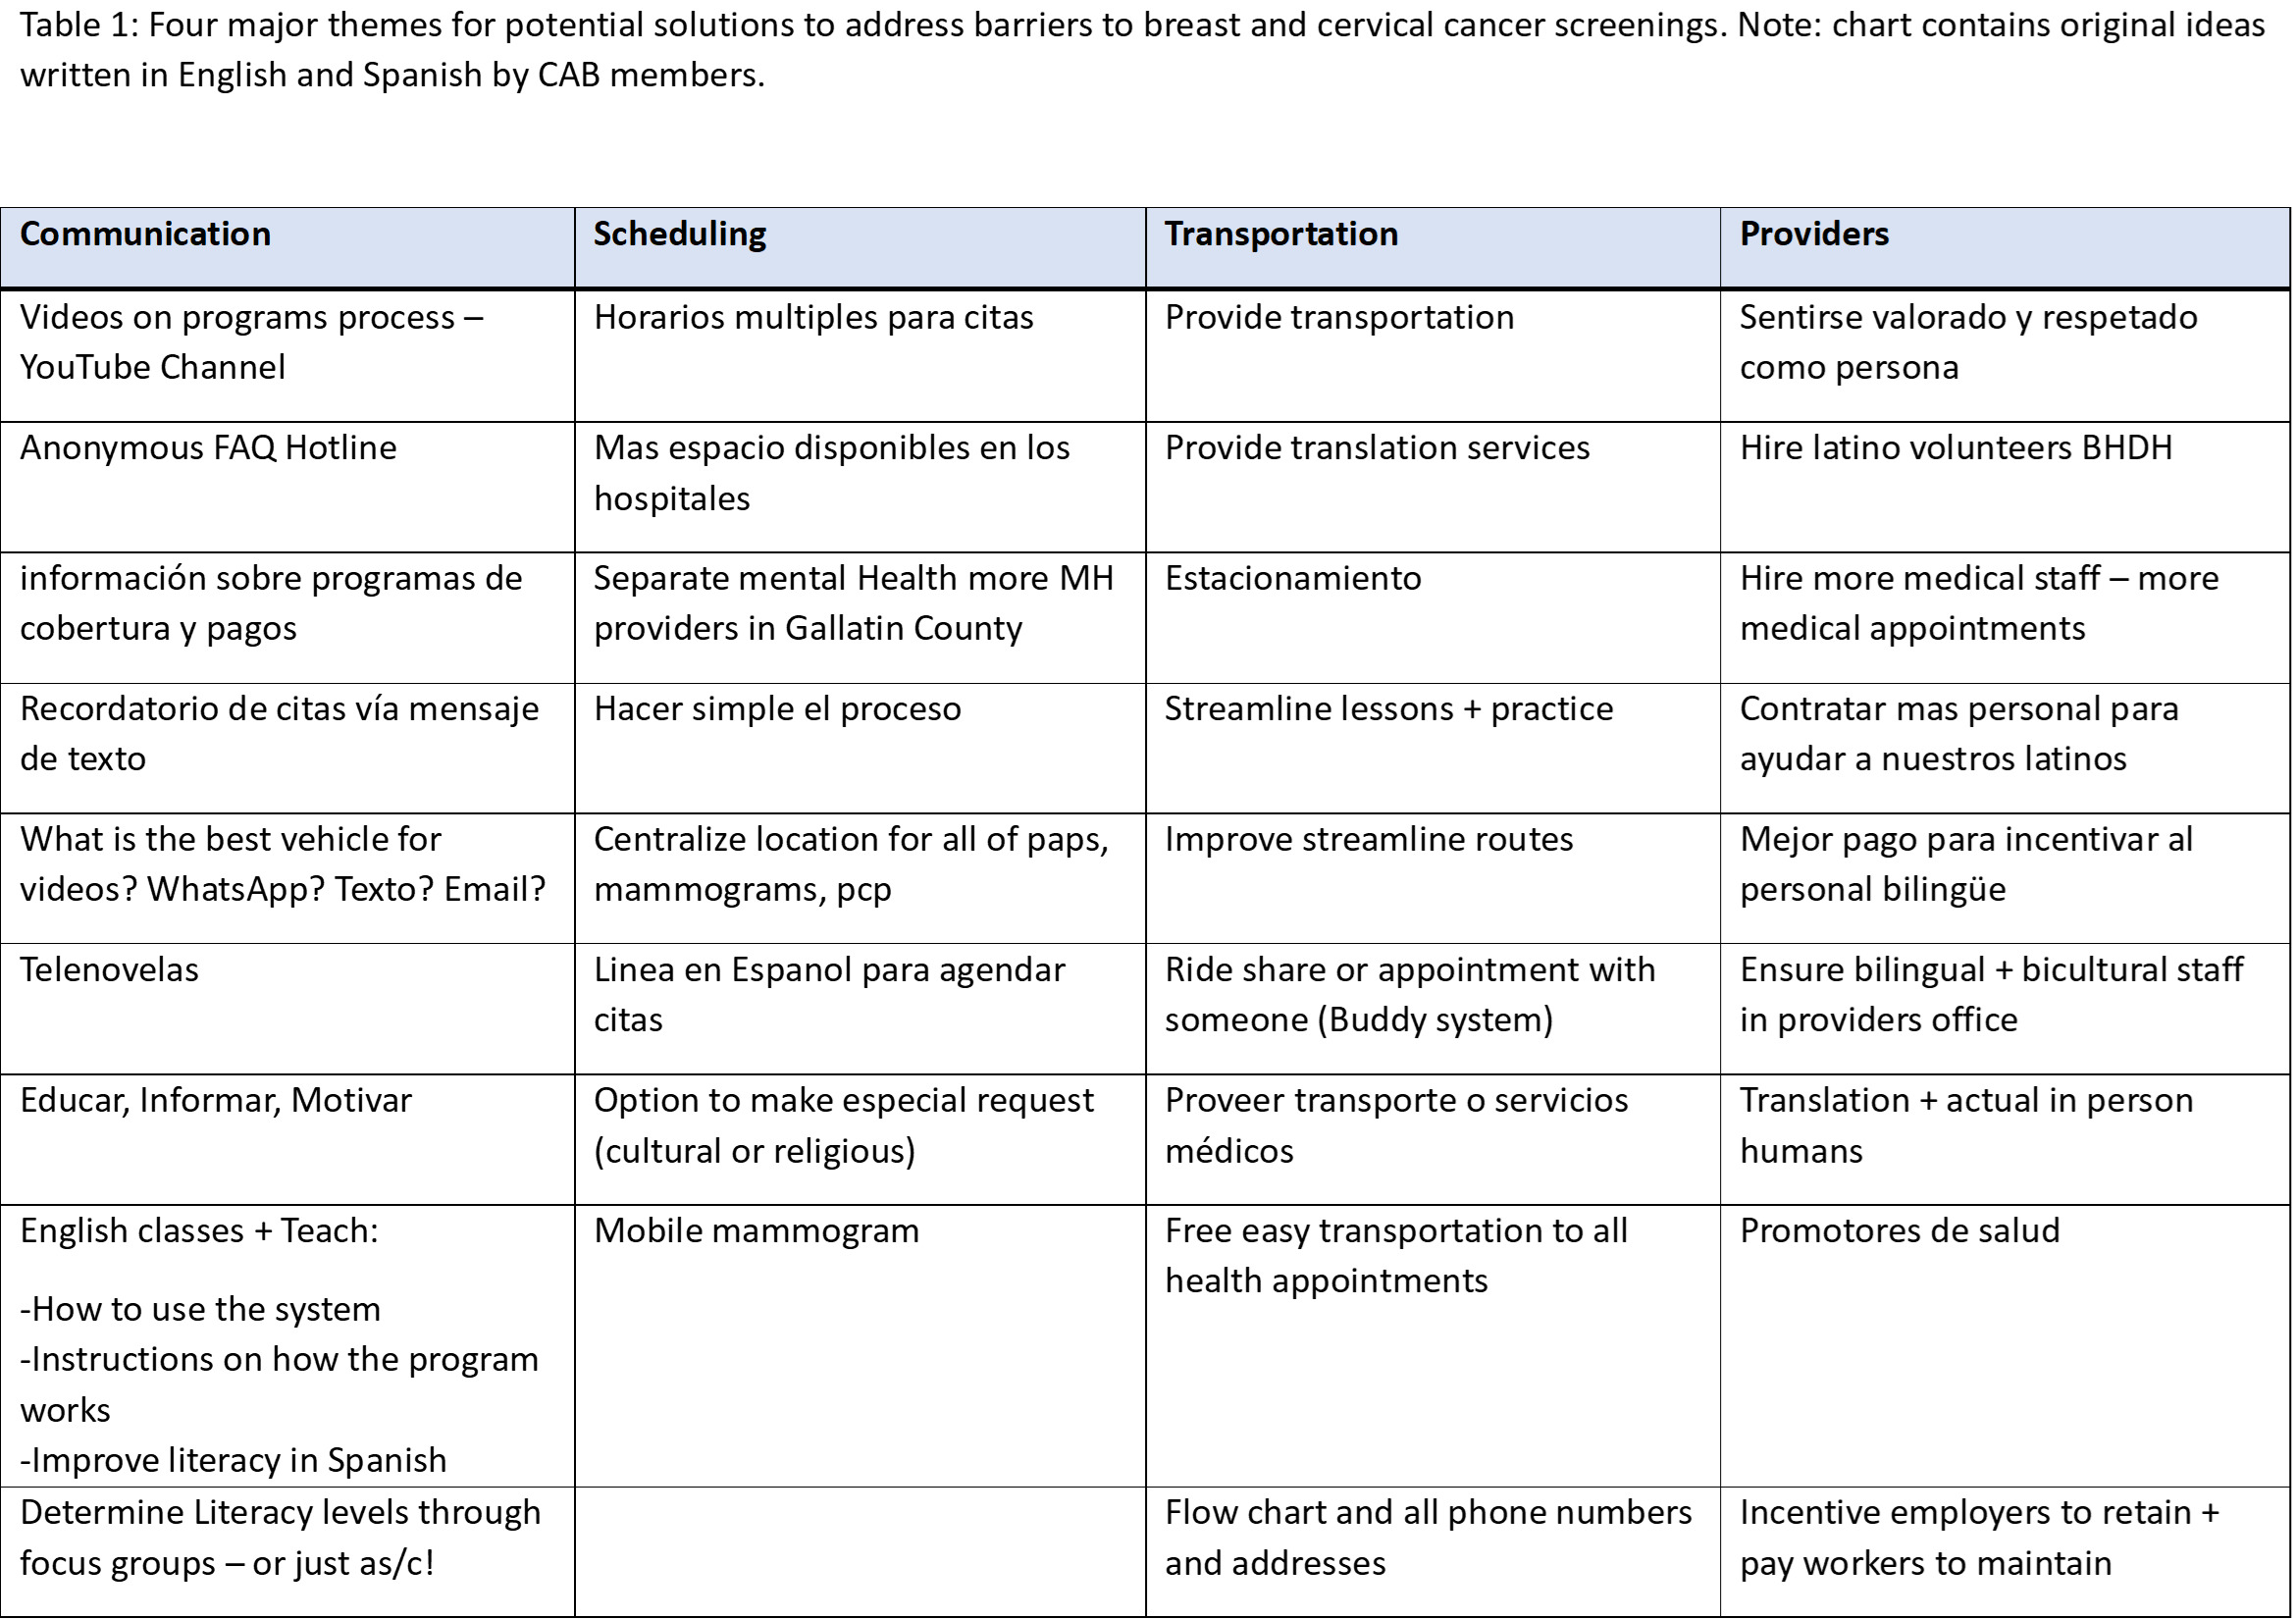
Concept Mapping. When the group had a visual representation of potential solutions, we began the concept mapping approach. The first step was to write down potential solutions on sticky notes, which we tacked to the wall at random. When the group had exhausted their ideas, the consultant read the notes aloud to the group. We then consolidated ideas, categorized the notes based on four common themes, and worked together to identify potential solutions. Figure 4 presents the consolidation of some of the ideas under these themes: communication, scheduling, transportation, and bilingual providers. Also see Table 1.
Common Themes
Communication. Language was one of the most commonly cited barriers to accessing screening services. Therefore, solutions under the communication theme focused on improving Spanish-language services and improving English skills of Spanish-speaking women. The CAB also brainstormed various ways to improve communication with all women eligible for services, including at churches and schools, through text messages and emails, instructional videos, and an anonymous Frequently Asked Questions hotline.
Scheduling. Barriers to completing screenings included a lack of available appointments outside of usual clinic hours. The CAB identified a need for mobile mammogram units or extended clinic hours for appointments. They also noted that childcare could be provided during appointments.
Transportation. Women who do not have adequate transportation often cannot attend their screening appointments. The CAB recommended that the local public bus system expand its routes and provide information in both English and Spanish. They also recommended the use of a buddy system or ride-share system to help women get to appointments.
Bilingual Providers. Overwhelmingly, the solutions in this category focused on creating a workforce of health professionals who are fluent in Spanish. The CAB proposed the use of community health workers or other health navigators to provide health literacy support, assist with scheduling and attending appointments, and help women understand their results. Another suggestion was to hire in-person interpreters rather than using telephone interpreting services at clinic and imaging center appointments.
Mapping Tools in a Community-Engaged Context
This research examined a methodologic approach to engage community members in community-oriented research by using mapping techniques to address barriers to accessing free breast and cervical cancer screening through the NBCCEDP. Creating solutions to address problems affecting the community requires insights and input from the affected communities, yet researchers often struggle to find a common language that allows community members to participate fully in generating solutions to community problems (Israel et al., 1998). Visualization and collaboratively mapping out the problem and proposed solutions is one way to engage the community in a systematic process.
Mapping tools have been used in multiple settings to bring research teams and community members together in solving complex issues. These tools include specific mapping techniques such as asset mapping (Sharpe et al., 2000), interactive mapping (Marshall et al., 2022), and community mapping (Tindle et al., 2005). Utilizing mapping methodologies may be a way to communicate more efficiently with community members about the research process. These mapping techniques can break down barriers that prevent the community from engaging in research processes. If community members understand the methods of the research process better, this may strengthen partnerships with communities to address and brainstorm solutions to barriers to accessing cancer screenings (Odedina et al., 2024). Mapping tools provide simple ways to visualize language, identify associations, and brainstorm potential solutions based on the lived experiences of those in the community (Kane & Trochim, 2007). They also provide a way for community members to prioritize data and to provide insight on their experiences within the community (Vaughn et al., 2017). Gaining insight and knowledge from the lived experiences of community members strengthens the quality of the research. Mapping allows for community cohesion and collaboration while creating sustainable and meaningful interventions to address health problems (Windsor, 2013). Concept mapping, in particular, assists researchers and communities to categorize qualitative data in a structured, accessible way and helps to identify creative solutions to complex problems (Burke et al., 2005).
The CAB received training on the mapping tools, and we constantly asked for their feedback not only on the outcomes but on the process. A couple of CAB members expressed their liking for the simplicity of the tools and mentioned they might implement some of the tools in their regular job activities. This provides evidence of the impact of community-based participatory research in which we are able to integrate research, outreach, and teaching and not only solve problems but also train community leaders in problem-solving techniques and visual mapping tools.
By actively involving community members and employing a visual language that is easily comprehensible, researchers can generate novel insights into the root causes of problems and potential solutions. This collaborative approach not only democratizes the research process but also ensures that the findings are relevant and actionable for the affected communities.
Conclusions
This research project combined mapping techniques and community-oriented research approaches to work with community members to discover potential solutions to barriers in accessing cancer screenings including communication, scheduling, transportation, and the need for bilingual providers. While we present the process of engaging the community through a CAB, when we asked the CAB members to be co-authors on this paper, they preferred to remain anonymous and declined our invitation. Mapping tools, when seamlessly integrated into the framework of community-based participatory research (CBPR), yield an array of compelling benefits for researchers, transforming the research landscape and enhancing community engagement. The symbiosis between these tools and CBPR not only amplifies the analytical capabilities but also facilitates a more inclusive and collaborative research process.
The use of mapping tools in CBPR transcends conventional language barriers, fostering a more accessible and inclusive dialogue between researchers and community stakeholders. Visual representations of data serve as a universal language, enabling individuals with diverse backgrounds to actively participate in the interpretation and discussion of findings. This democratization of the research process ensures that community members, regardless of their academic expertise, can meaningfully contribute to the analysis and interpretation of spatial data, fostering a sense of ownership and shared responsibility. It also allows for the identification of spatial patterns, disparities, and potential intervention points, providing a nuanced understanding of the community’s needs and assets.
Furthermore, mapping tools serve as dynamic platforms for ongoing collaboration. Real-time updates and feedback loops facilitated by these tools create a continuous dialogue between researchers and community partners. This iterative process not only strengthens the relationship between academic and community collaborators but also ensures that the research remains responsive to the evolving dynamics of the community.
In short, the integration of mapping tools into CBPR represents a transformative approach that enriches the depth and breadth of community-centered research. Through spatial visualization, inclusive dialogue, and ongoing collaboration, researchers can leverage these tools to uncover insights and empower communities in addressing complex challenges. As the field of research continues to evolve, the integration of mapping tools in CBPR stands out as a promising method.